Overview
Census estimates of vacant dwellings are a helpful measure of the housing stock within a given area. In 2001 this measure was further broken down to provide a figure of vacant dwellings that were second homes and holiday homes, whilst the Census 2011 provided only an overall estimate of household spaces with no residents.
This distinction is important, as the more detailed breakdown shows the proportion of dwellings in a given area that are vacant without being occasionally occupied as holiday accommodation or second homes – and is therefore an insight into the amount of housing stock that is absent from the market despite being empty. This can then be looked at alongside other measures of housing demand versus housing supply across the country.
About the data
Given the outdated nature of the Census 2001 measure on vacant dwellings (excluding second homes and holiday accomodation), we have created an updated estimate of vacant dwellings in 2017 at Output Area level. This is based on a combination of Local Authority level estimates of vacant dwellings for 2017, Census 2011 household spaces with no residents and Census 2001 vacant dwellings.
The new data has now been added to Local Insight. To explore the data, matched to the communities you care about, sign up for a free trial.
How was this dataset created?
The dataset was created as a proportion of all dwellings that are vacant in an area, excluding second homes and holiday homes.
Firstly, using the above data sources, the 2017 count of vacant dwellings by Output Area was calculated as follows:
- Calculate an estimate of vacant dwellings in 2011 based on the total number of households with no residents (Census 2011) * the proportion of all dwellings that were vacant dwellings excluding second homes and holiday homes (Census 2001).
- Calculate the share of vacant dwellings in each Output Area in 2011 = 2011 estimate of vacant dwellings (created in stage 1) * Local Authority District vacant dwellings (2017).
- Multiply the Output Area share created in stage 2 by the Local Authority 2017 vacant dwellings count to get a 2017 Output Area vacant dwellings count.
Secondly, the rate was calculated and displayed on Local Insight Insight as follows = Output Area vacant dwellings count 2017/Total dwellings (Census 2011).
What do the estimates show?
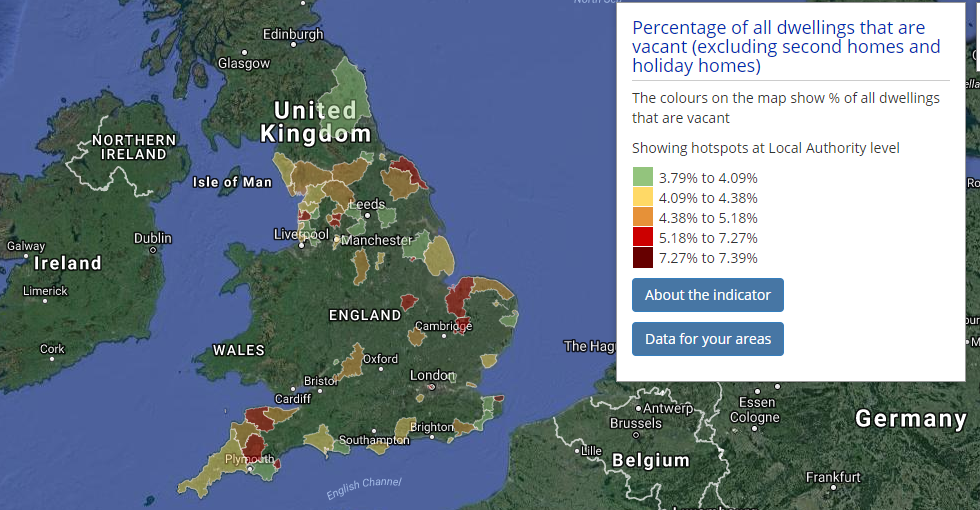
At a higher geographic level, mapping the data by hotspots in Local Insight shows a few interesting trends:

- Even when excluding second homes and holiday homes, many of the areas with the highest levels of vacant dwellings are outside of major cities – in rural areas and coastal towns e.g. coastal towns in Cornwall, Devon and Norfolk, as well as rural areas in Yorkshire and The Cotswolds.
- However, there are also high levels of vacant dwellings at small area level in more populated Northern cities such as Nottingham, Stoke, Stafford, Sheffield, Liverpool, Preston and Leeds.
- Wealthier London boroughs also have higher levels of vacant dwellings (excluding second homes and holiday homes) than other boroughs in the capital. Particularly in Westminster, Kensington and Chelsea and the City of London.
Sign up for a free trial of Local Insight to explore the data for yourself in more detail for the wards and specific communities you work in, as well as compare the data to hundreds of other socio-economic datasets.
Further information about the data and sources
- Local authority level 2017 estimates are drawn from several separately published sources including all vacants and long-term vacants from the Council Tax Base (CTB), Local Authority vacants and Other public sector vacants from the Local Authority Housing Statistics (LAHS) and Private Registered Provider (housing association) vacants and long-term vacants from the 2012 Homes and Communities Agency’s Statistical Data return (SDR), see here for more information: https://www.gov.uk/government/uploads/system/uploads/attachment_data/file/685575/LT_615.xls
- Census 2011 data is based on a record of households with no residents from the table KS401EW Dwellings, household spaces and accommodation type https://www.nomisweb.co.uk/census/2011/ks401ew
- Census 2001 data is based on a record of housing stock that is categorised as a vacant household space or second residence/holiday accommodation, from the table UV053 Housing stock https://www.nomisweb.co.uk/census/2001/uv053
Featured posts

Data analysis
OCSI created the first version of the Community Needs Index in partnership…
More

OCSI news
We are looking for a User Support Officer to join the team…
More
OCSI news
About OCSI Based in Brighton, we are a social research consultancy with…
More