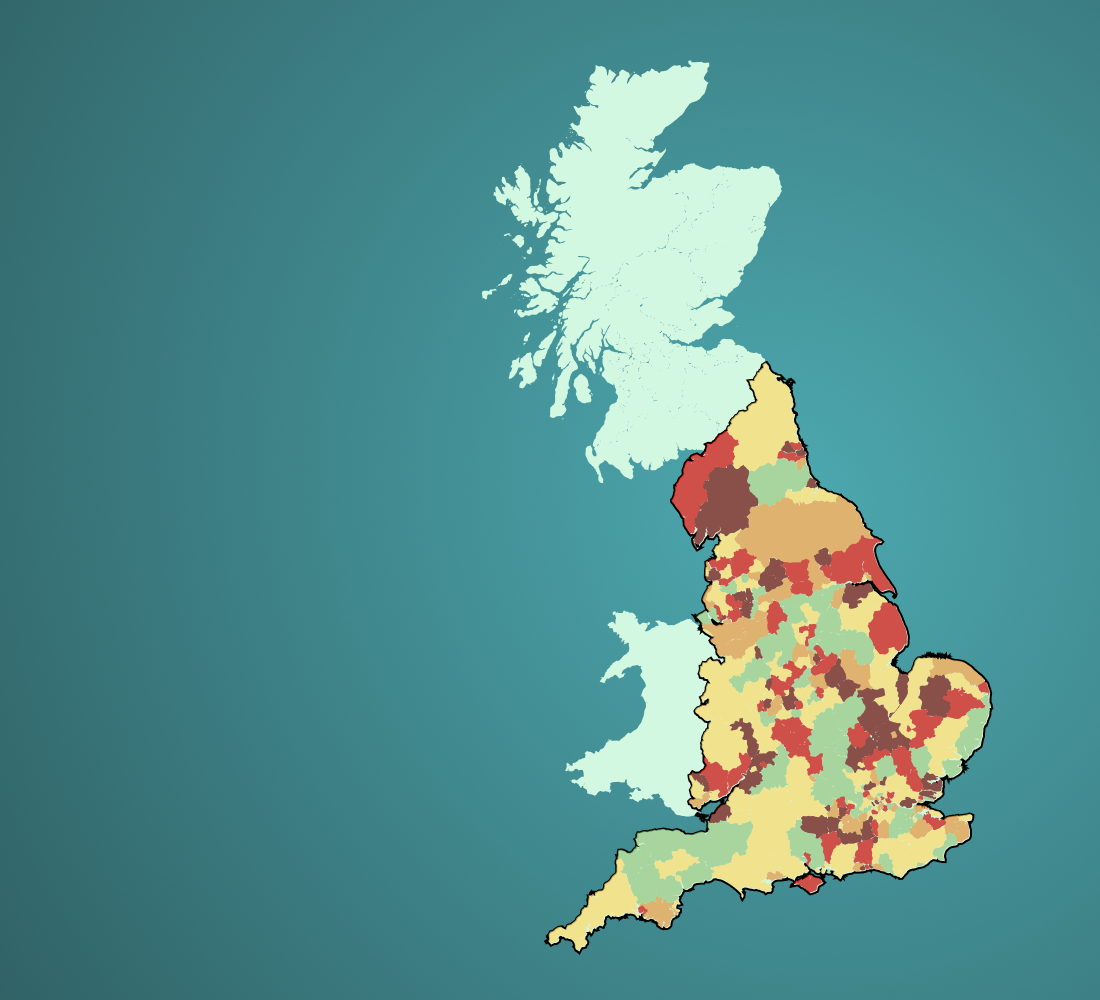
The English Indices of Deprivation 2025 show where disadvantage is concentrated across neighbourhoods in England.
The Index of Multiple Deprivation (IMD) ranks every neighbourhood on a range of key measures across seven domains of deprivation. It is one of the most widely used measures for targeting resources to the places most in need.
Whether you’re in local government, social housing, health or the voluntary sector, this data is essential for making the case for investment and shaping policy decisions.
Save days of manual work and free up your time to focus on the analysis that really matters with an instant Indices on Demand report.
Typical in‑house effort
9+ days saved
Estimates based on typical analyst workflows. Actual effort varies by scope and local context.
What you get instantly
Explore the latest Indices of Deprivation, compare your area nationally and track how deprivation is changing over time – giving you the insight to shape effective policies and services.
Guidelines for usage
Clear guidance on how the IMD should be interpreted so that you can confidently apply the findings in practice
Index of Multiple Deprivation (IMD)
Understand overall levels of deprivation using the IMD, with comparisons to national and regional benchmarks
Domain Analysis
See how your area performs across the seven domains, starting with a summary view at a glance, followed by in‑depth analysis of each domain
Changes in deprivation
Track how relative deprivation has changed over time to spot persistent challenges and emerging trends
Further reading
Broaden your understanding with relevant resources curated by our team
Receive an instant report for your recognised geography, or commission a bespoke report tailored to your geographies, indicators and audiences, curated by the data experts behind the IMD.
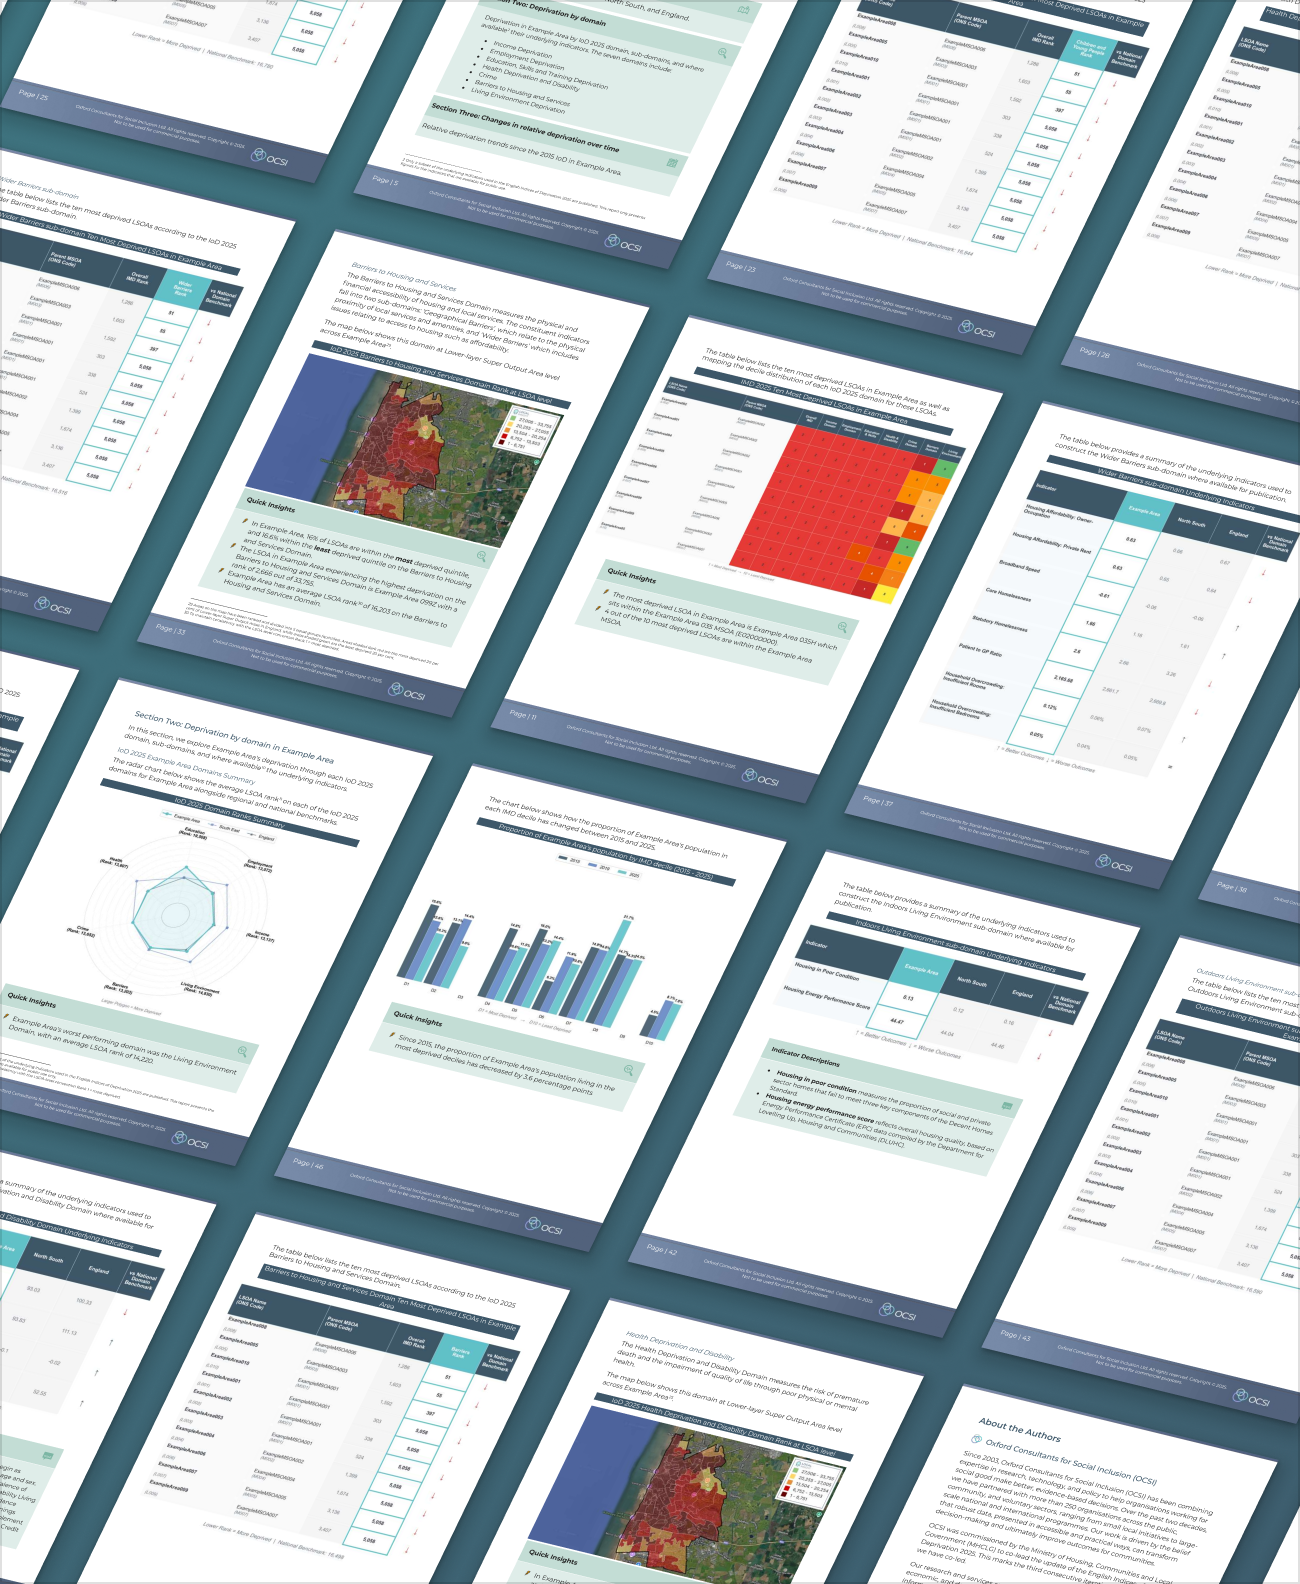
In‑depth IoD2025 analysis (including a focus on the IMD) with advanced visuals and trusted benchmarks for recognised geographies in England.
Get your indices on demand report
Secure checkout Powered by Stripe • Instant delivery
Bespoke IMD 2025 Analysis
Your areas, your boundaries, your IMD 2025 report.
Custom analysis from £1,995
The Multi-Area Intelligence Packs give you the same trusted data and analysis for multiple geographies,
providing complete coverage, fair pricing and consistent insight in one deliverable.
Build your intelligence pack from any Upper Tier Local Authority, Local Authority District,
Parliamentary Constituency or Community Foundation Patch.
| Number of Areas | Indicative Price (ex. VAT) | Example Use Case |
|---|---|---|
| 1 area | £495 | Single district, borough, or unitary |
| 2 – 3 areas | £895 | Small group or neighbouring authorities |
| 4 – 5 areas | £1,250 | Small county or benchmarking set |
| 6 – 8 areas | £1,650 | Typical county coverage |
| 9 – 11 areas | £2,050 | Larger county or regional partnership |
| 12 – 15 areas | £2,450 | Extended benchmarking or large system |
| 16+ areas | Bespoke / quote-based | Regional or national frameworks |
Tell us how many areas you’d like covered and we’ll confirm total cost and get your Intelligence Pack delivered to you.
Order your Multi-Area Intelligence Pack
Find answers to common questions about our IMD 2025 reports.
Indices on Demand reports can be produced instantly for recognised geographies in England, including:
Yes – please email support@ocsi.co.uk if you would like to buy multiple reports. We also offer discounts for organisations buying more than one report.
Please email support@ocsi.co.uk with the name of the area you are interested and a member of our team will be able to help you.
Your Indices on Demand report is delivered instantly in multiple formats, including:
This ensures you can integrate the findings into your own workflows and presentations
Yes – please get in touch with support@ocsi.co.uk and we can arrange sending you an invoice. Please note, we will need to receive payment before providing your report.
Yes. After completing your purchase, you can download your receipt or VAT invoice directly. A link will be provided in your confirmation email, allowing you to access and save your receipt or VAT-ready invoice at any time.
Yes. Once you’ve purchased your Indices on Demand report, you’ll receive a licence to use it for your organisation’s work. You can share the report internally and with partners, funders or collaborators who are directly involved in the same project, as long as it’s being used for social good, planning, research or other non-commercial purposes. We kindly ask you to credit OCSI should Indices on Demand visualisations be used in presentations or follow-up reports.
Please be aware that you can’t resell, republish, or distribute the data publicly, nor use it in a commercial product or service without prior written permission from OCSI. If you’re unsure whether your intended use is covered, contact us at support@ocsi.co.uk
Yes. The Indices on Demand report is designed for use across sectors, including local authorities, NHS trusts, housing associations, grantmakers and third sector organisations. It provides a clear evidence base for funding bids, policy development, resource allocation and strategic planning.
No. The report is written in plain English, with clear explanations of how to interpret IMD and domain scores. It includes guidance on using the findings in practice, as well as visualisations and benchmarking to make the insights accessible to both technical and non-technical audiences.
Yes. If your needs go beyond the standard geographies or if you require tailored indicators, OCSI offers bespoke IMD 2025 analysis. This includes:
For organisations needing in-depth or targeted reporting, get in touch.
The English Indices of Deprivation (IoD 2025) are a set of measures that describe different types of deprivation for small areas in England. They include the Index of Multiple Deprivation (IMD), seven domain indices (income, employment, education, skills and training, health deprivation and disability, crime, barriers to housing and services, living environment) and supplementary indices for specific age groups: the Income Deprivation Affecting Children Index (IDACI) and the Income Deprivation Affecting Older People Index (IDAOP). We’ve written a beginner’s guide, which offers a more comprehensive explanation of the measure.
The English Indices of Deprivation 2025 will be freely available to access via the Government website from 09:30 on Thursday 30th October 2025.
The Index of Multiple Deprivation (IMD) is the official measure of relative deprivation for Lower-layer Super Output Areas (LSOAs) in England. It ranks every neighbourhood from 1 (most deprived) to 32,844 (least deprived), based on seven weighted domains of deprivation. This allows for comparison between areas, showing where disadvantage is concentrated. It is a relative rather than absolute measure, meaning it can identify which areas are more deprived than others, but not by how much.
OCSI (Oxford Consultants for Social Inclusion) are co-leaders on the development of the Indices of Deprivation (IoD) and Index of Multiple Deprivation (IMD). OCSI was commissioned to update the IoD and IMD in 2015, 2019 and now 2025. Alongside our work to develop the IMD, OCSI has developed the place-based data insight platform Local Insight, and created complimentary measures like the Community Needs Index.
The Indices on Demand report saves significant time compared to manually sourcing and analysing raw IMD data. It provides:
Typical in-house workflows to produce similar analysis can take 12+ days of work, while the report is delivered instantly
Official IMD results are published at LSOA level, not at ward level. This is because the indices are designed for small, relatively even-sized neighbourhoods. However, IMD scores can be aggregated to ward level in several ways, such as:
Local Insight can automate this aggregation, presenting results for wards and other boundaries in accessible tables, maps and reports
Following publication of IoD 2025, the IMD data can be explored using Local Insight, OCSI’s place-based data platform. This allows users to:
Local Insight makes it easy to visualise and analyse IMD data interactively, without needing specialist data skills
An Indices on Demand report provides a highly detailed analysis for standard geographies such as local authorities and parliamentary constituencies. It includes advanced visuals, predefined comparators like national and regional benchmarks, and is delivered instantly in multiple formats (PDF, Word and CSV).
With a Local Insight subscription, you can generate a report with a focus on deprivation – but a lighter level of analysis. A Local Insight report is more flexible, with the option to define your area at a neighbourhood level (for example, Electoral Wards or a combination of LSOAs) and select your own comparators. It includes an interactive web version, as well as a downloadable Word document. While the analysis is lighter, it offers greater control over the geographies and comparisons used.
Save hours of manual research with instant, in-depth analysis of the English Indices of Deprivation 2025
Get your indices on demand report