We hold over 1,500 regularly updated neighbourhood-level indicators across a number of different themes
Discover more about the areas you work with, through our sophisticated maps, reports and dashboards
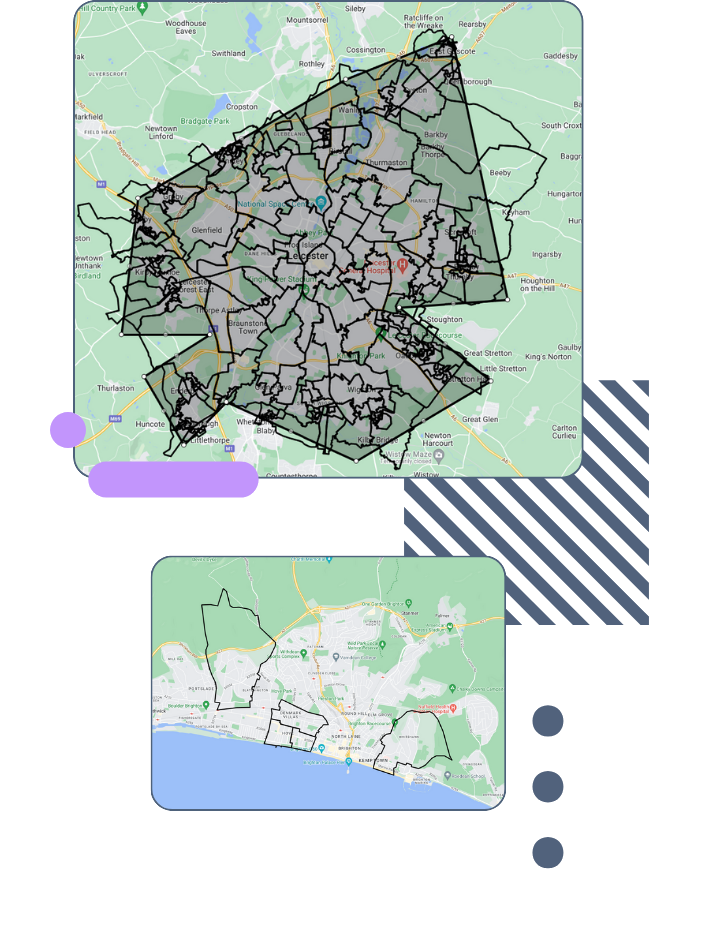
Pinpoint areas of any size or shape and carry out detailed bespoke analysis with precision
Upload your own data to the tool to comprehensively map your service provision and ensure your funding is reaching the right places
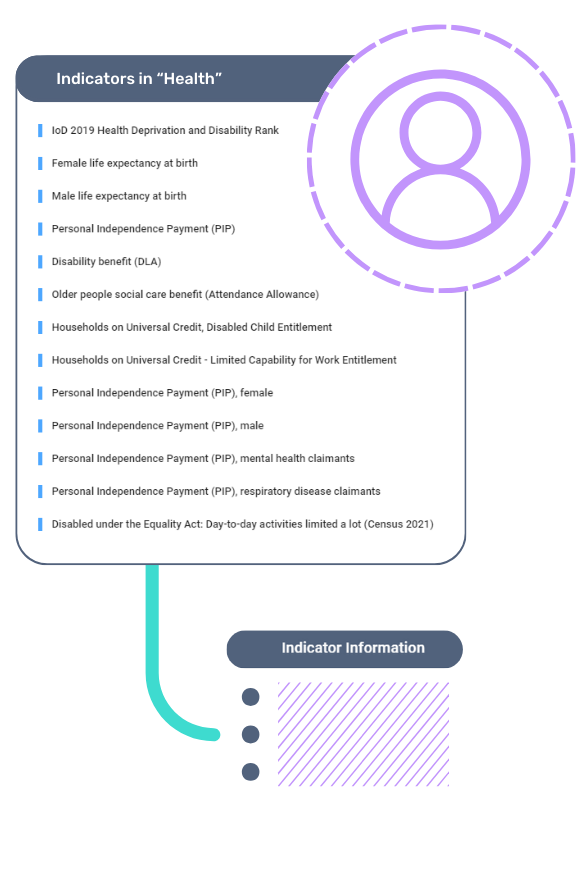
Local Insight holds over a 1,500 neighbourhood level indicators from over 50 different sources – and this is continually growing.
Statistical geographies, such as Lower Super Output Areas (LSOAs) are useful – but they don’t tend to relate to meaningful communities.
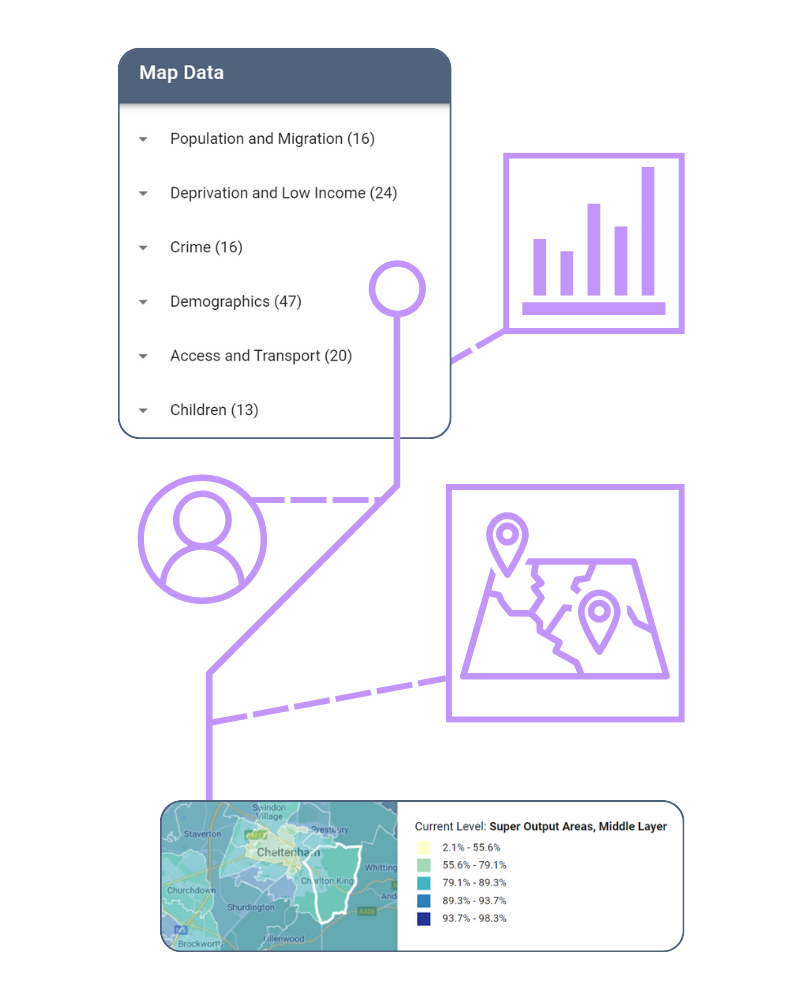
Quickly and easily find the information you need, in the format you need it. The wide range of visualisations means there is something for everyone.
Use:
Local Insight is easy to use, so you don’t need to be a statistician to gain useful insights about your neighbourhoods.


A new need for deeper place-based insight When Arts Council England launched…
More
In Wales many areas face dual challenges, lacking accessible local assets like…
More
Everton in the Community (EitC) is a leading sports charity, working to…
More
Hertfordshire Sport Partnership (HSP) is a key partner in coordinating Hertfordshire’s Holiday…
More