
If this blog post has caught your eye, then you probably have some interest in using place-based data – excellent! Us too! There is lots of jargon and overlap surrounding the underlying geographies that data is published at. In addition, there are many different types of areas that are used day-to-day across different organisations. This resource untangles some of that jargon and introduces some of the intricacies of standard geographies. From LEPs to LSOAs, all will be revealed.
When we talk about place-based data here, we mean the sort of data that we include in our Local Insight platform. This ranges from well-known Census and Indices of Deprivation data to a wealth of housing, health, crime and education data, to more specific datasets such as the prevalence of loneliness or the amount of green space per local area. (You can take a look at selection of the data we hold on our public site here).
This guide is for you if you:
The vast majority of place-based open data is published at at least one of the following geographies. Output Areas and Super Output Areas are standard areas that were primarily designed for the publication of the Census. They are fairly homogenous in terms of population size. So, you can compare like-for-like when looking at changes over time and when comparing different areas and different datasets.
Output Areas (OAs): These are the smallest of the geographies that data is published at and have an average population of about 310 residents (the table below shows the upper and lower thresholds). Not very much data is available at this level, although many Census outputs are.
Lower Layer Super Output Areas (LSOAs): LSOAs have an average population of 1500 people or 650 households. A lot more data is available directly at LSOA level, including the majority of the data included within our tool, Local Insight.
Middle Layer Super Output Areas (MSOAs): MSOAs have an average population of 7500 residents or 4000 households. There are some datasets out there that are published at MSOA level as the smallest geography – for example estimates on prevalence of different health conditions.
| Area type | Lower threshold | Upper threshold | ||
| People | Households | People | Households | |
| Output Areas | 100 | 40 | 625 | 250 |
| Lower Layer Super Output Areas | 1,000 | 400 | 3,000 | 1,200 |
| Middle Layer Super Output Areas | 5,000 | 2,000 | 15,000 | 6,000 |
| Electoral wards/divisions | 100 | 40 | n/a | n/a |
| Source: Office for National Statistics | ||||
The whole of England and Wales can be broken down into these constituent areas sort of like building blocks (Scotland and Northern Ireland are a different story). OAs nestle within the boundaries of LSOAs, LSOAs nestle within the boundaries of MSOAs and MSOAs nestle within the boundaries of Local Authorities.
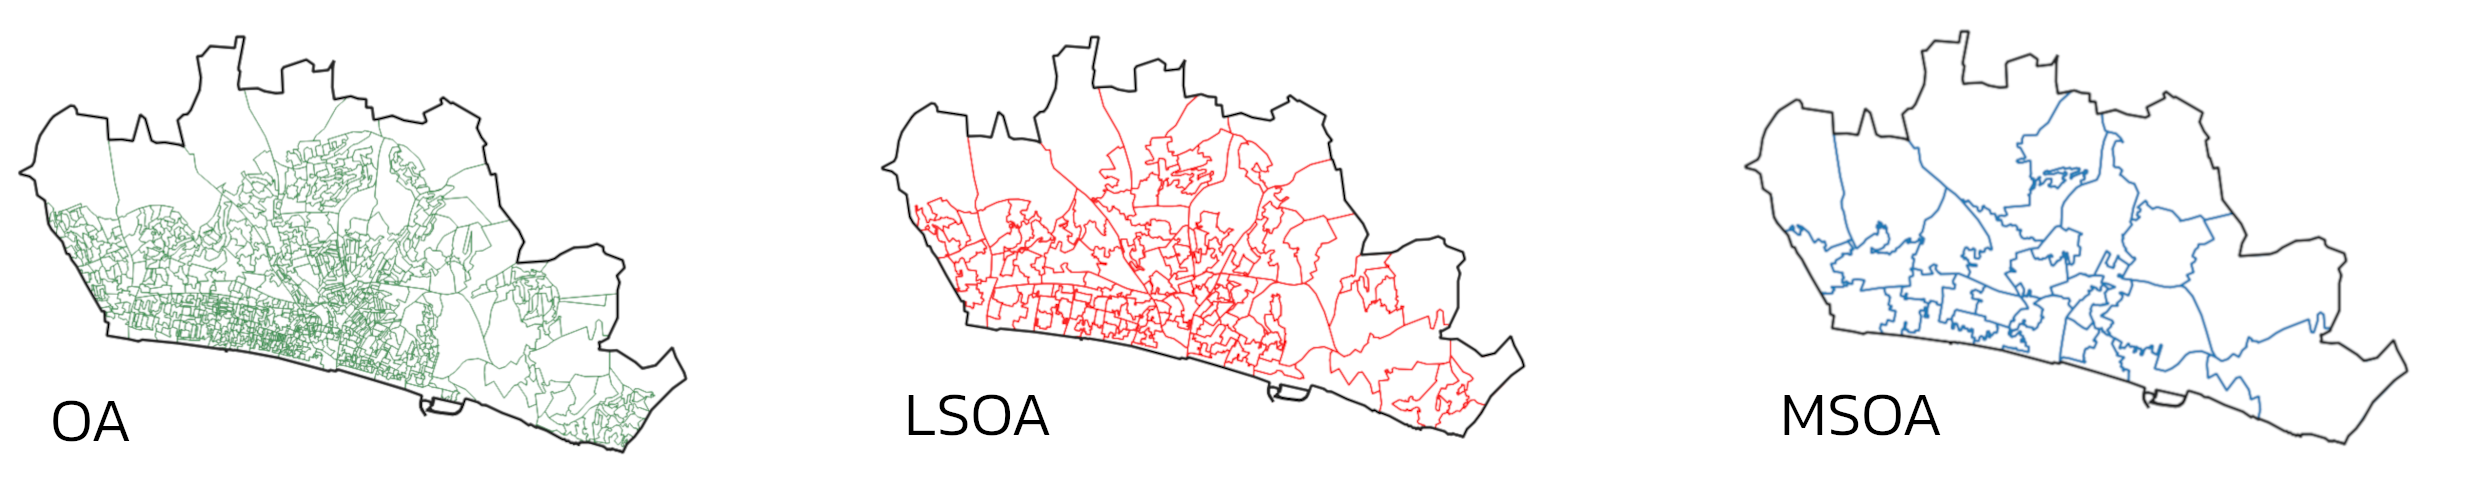
Image shows OAs, LSOAs and MSOAs within Brighton & Hove
These geographies are really useful in providing the structure for collecting, processing, storing and aggregating data, as well as being a great unit to show comparison. However, they do have one pretty big drawback and that is people do not tend to relate to them, at all. There are no names associated with LSOAs and they cut across neighbourhoods rather than aligning with real communities on the ground.
People generally tend to be more familiar with the term wards and will be more likely to identify which ward they are from, rather than which LSOA. Wards are a very useful unit for analysis precisely because of this.
However, ward level data is often not published directly. Firstly, because ward boundaries change a lot and are therefore less likely to be consistent over time (not too mention the administrative headache it would be). Secondly, wards vary greatly in size (anything from 1000 to 30,000 people), and therefore it is difficult to compare different areas to each other.
So when using place-based data, you may need to source data for different types of areas depending on the questions you are trying to answer and the audiences you are engaging with (read to the end for resources that can help with this).
Below are some other types of geographies that you may come across on your travels. Again, the majority of place-based data isn’t published directly at these levels. However, it is possible (in most cases) to aggregate to these geographies. These geographies are not used as much as wards, but useful to be aware of nevertheless.
If there are any other types of areas you want included in this guide, please get in touch on support@ocsi.co.uk – we’d love to know what is helpful!
Parishes are the lowest tier of local government. Unlike Super Output Areas & Wards – not everywhere is covered by a parish. Approximately 35% of the English population live in a civil parish.
As with wards, parishes can vary greatly in size, with some of the smallest having fewer than 100 residents. This can make it quite tricky to get accurate data for these areas, as place-based open data doesn’t tend to be published at this level of granularity.
Parishes are a particularly useful unit of geography when looking at rural deprivation. Rural parishes tend to be very small, and more reflective of the actual communities on the ground than LSOAs. This means a Parish is likely to contain households of a more similar socioeconomic demographic than a rural LSOA would.
LEPs are voluntary partnerships between local authorities and businesses, straddling multiple local authorities to help determine local economic priorities (such as approaches to economic growth and job creation).
There are currently 38 LEPs and these are not mutually exclusive. For example; Lewes District Council is a member of both the South East LEP and the Coast to Capital LEP.
For the most part, they match to local authority boundaries. So it is fairly straightforward to aggregate local authority level data to these geographies. However, as with every good rule – there are exceptions. For example, Hampshire has a couple of districts that are split over different LEPs.
There are 650 Parliamentary Constituencies across the UK. One Member of Parliament (MP) represents each of these areas. These boundaries largely use local government wards as the building blocks for proposed constituencies.
Again, these constituencies vary in size and population and this is regularly reviewed. The last Boundary Review was completed in 2023, and was stricter than previous ones – with the Boundary Commission ruling that constituencies must must now have populations within 5% of the ‘electoral quota’ of 73,393.
While changes were made to the size of hundreds of boundaries – just over half of the existing constituencies (332) remained very similar to their closest successor (with over 90% of premises in the same constituency before and after the change). These changes then took effect at the 2024 General Election.
For more detailed information on the proposed upcoming changes, take a look at the background information put together by Boundary Commission for England.
The ONS Open Geography Portal is a really handy resource for converting statistical geographies such as OAs and LSOAs into other more meaningful geographies such as wards or parliamentary constituencies.
If you want to know which underlying areas make up your wards, then the LSOA 2021 – Wards lookup is a good place to start.
We have a short guide to help you use the Open Geography Portal. This covers downloading shapefiles and using lookups.
Once you know which underlying geographies make up your wards, you are one step closer to converting OA or LSOA level data to ward level data. However, it can still be a fairly time-consuming & complex process to do so.
Our tool Local Insight does the hard work for you. Set up your neighbourhoods and wards as ‘Custom Areas‘ and Local Insight will instantly aggregate any of the more than 1500 local level datasets to these areas. This means you can get instant access to data for the areas you care about, including the Indices of Deprivation, Universal Credit or local health data.
The data is updated regularly, with any new or updated datasets added to the system within a working week of release. If this sounds like it could solve some of your data headaches, get in touch for a demo and free trial.

The English Community Needs Index (CNI) 2023 is now published as open…
More
Social housing providers have deep, experience-based knowledge of the communities they serve….
More
Many funding programmes use the Index of Multiple Deprivation (IMD) to identify…
More


