UKGrantmaking and Community Foundations

Decorative image with the text "Data and resources"

What is UKGrantmaking?

UKGrantmaking is a landmark publication on the state of grant funding in the UK, published in June 2024.  It is a unique cross-sector collaboration bringing together key stakeholders from across the sector, including 360Giving, the Association of Charitable Foundations, the Association of Charitable Organisations, UK Community Foundations and London Funders.

The interactive platform brings together data on more than £20 billion of funds, all in one place, for anybody to access. 

How is the data collected for UKGrantmaking?

The analysis is based on information from regulators, statutory accounts and data published using the 360Giving Data Standard.  The analysis is largely based on grants made in 2022-23 (which is the most recent year that had statutory reports available).

UKGrantmaking acknowledges that the data and overall approach are imperfect and welcomes feedback on the quality of the data and approach. The methodology and data page gives a thorough overview of the challenges of working with grantmaking data (and also provides a really handy table detailing the segmentation of the different organisation types referenced in the platform). 

How can I access the data used in UKGrantmaking?

UKgrantmaking contains interactive visualisations throughout the report and you can download the underlying indicators from any table or charts.

The grants data used can also be accessed through GrantNav or the National Lottery grants database. 

What are community foundations?

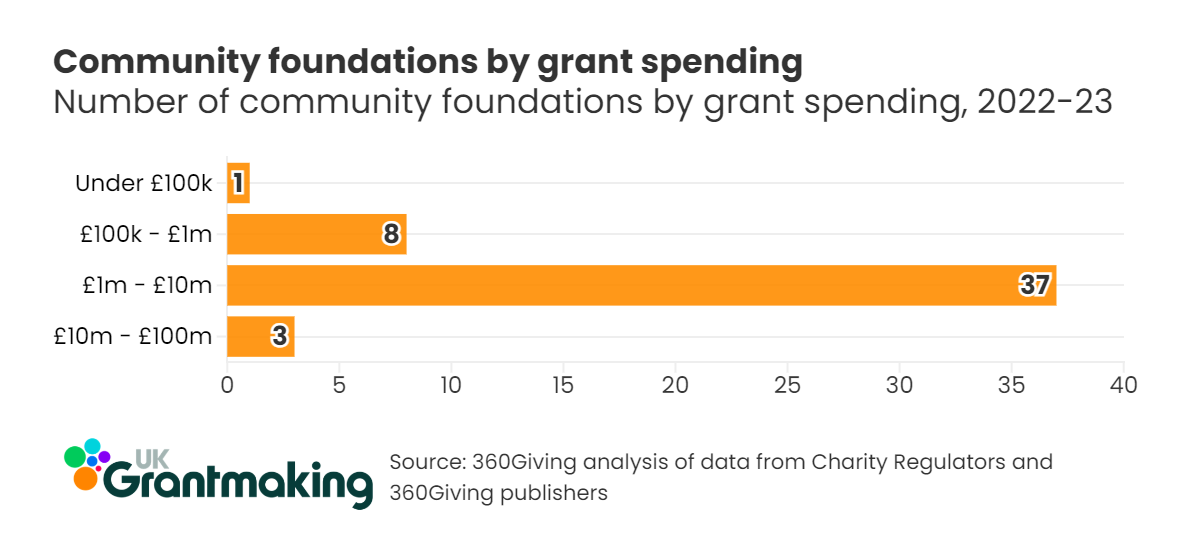
Community foundations are charitable grant-making organisations focused on supporting a defined geographical area. 

Community foundations vary enormously in size but all have place-based funding at their core and are uniquely placed to connect people and organisations with local causes that matter to them. They do this from generating philanthropic donations and endowments from local people that want to make a lasting impact in their community.

Given the local knowledge community foundations hold about their communities, they are often used as local delivery partners to distribute national grants, for example, the Care Leavers Programme and Know Your Neighbourhood Fund.

There is a network of 47 community foundations across the UK. Scotland, Wales and Northern Ireland each have a single community foundation that serve communities across their respective nations. English community foundations tend to align more closely with county boundaries or metropolitan areas. There are also two non-accredited community foundations (Tees Valley Community Foundation and Community Foundations for Wakefield). 


What are the key grantmaking trends for community foundations?

Grantmaking spend varies enormously between community foundations

  • Grantmaking spend in 2022 – 2023 varied from £23.4m (Foundation Scotland) to around £500,000 (Derbyshire Community Foundation)
  • The majority of community foundations (37/49) distributed between £1m – £10m in grants in 2022 – 2023
  • Three community foundations (Foundation Scotland, Community Foundation for Northern Ireland and London Community Foundation) distributed between £10m – £100m in grants in 2022 – 2023

An image of a bar chart showing number of community foundations by grant spending

Community foundation grantmaking spend has increased

  • In 2021 – 2022 the total grantmaking spend from UKCF members was £151.3m 
  • In 2022 – 2023, this increased to £175.2m, which is a 15.8% increase (and a real term increase of 6%)
  • Foundation Scotland showed the largest change in grant spending between 2021 – 2022 and 2022 -2023, increasing from £17.5m to £23.4m.
  • The Community Foundation for Staffordshire showed the largest percentage change in grant spending with an 183% increase (from £12.3m to £3.55m).
  • 31/49 of the community foundations increased their grant spending between 2021 – 2022 and 2022 – 2023, 16/49 reduced their grant spending and two remained largely the same.

Community foundation funding covers multiple and broad themes

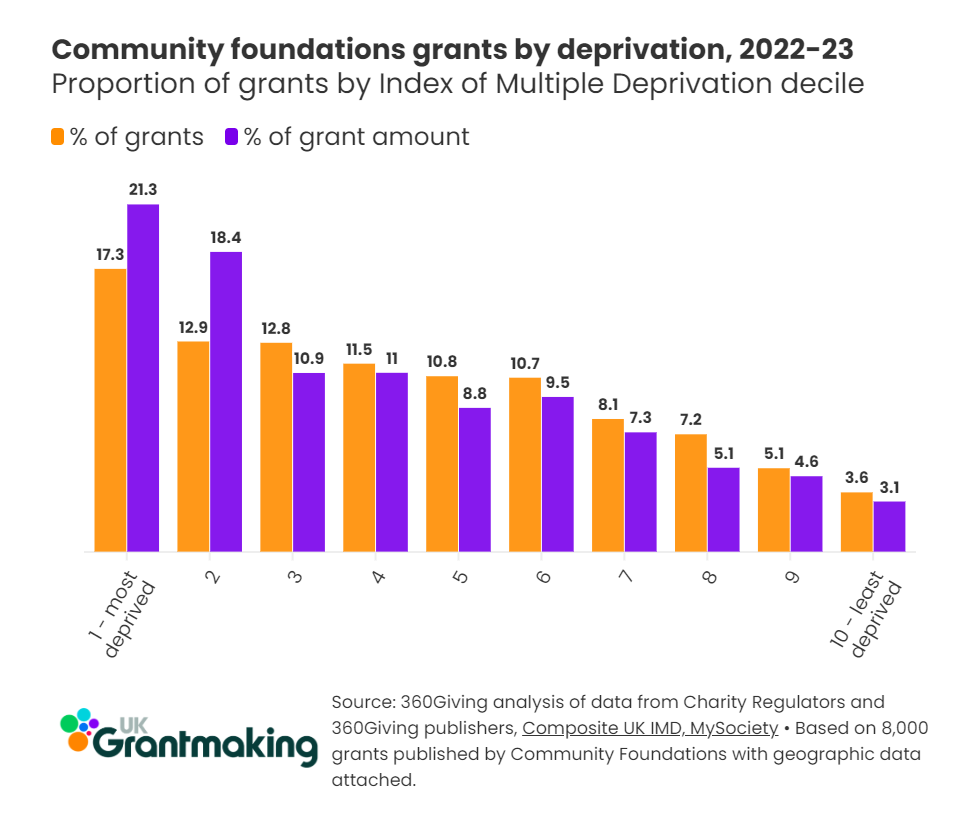
In 2022 – 2023, funding was distributed across a number of themes including:

  • £73.2m to cost of living, winter and other immediate support
  • £49m to health and wellbeing
  • £28.5m to improving diversity and inclusion
  • £12.8m to community sector development
  • £3.5m to environmental climate / activities
  • £2.3m to disaster relief
  • £1.2m to social investments 

Community foundation spending per head of the population varies enormously

  • Cumbria Community Foundation has the greatest spend per head of the population at £11.53 in 2022 – 2023, followed by Community Foundation for Calderdale (£11.07) and Somerset Community Foundation (£8.84)
  • Community Foundation for Wakefield District had the smallest spend per head of the population at £0.28 per head, followed by Lincolnshire Community Foundation (£0.45) and Derbyshire Community Foundation (£0.47)
  • However, spending by individual community foundations will vary over time according to the resources available and the life cycles of their grant programmes. 

Do community foundation grants go to the areas most in need?

  • UK grantmaking analyses community foundation grants by deprivation. It is based on grants that have geographic data at LSOA level for the beneficiary location. Around 8,000 out of the 12,300 grants published by community foundations in 2022 – 2023 could be matched to an LSOA.
  • Deprivation data is based upon a composite version of the Index of Multiple Deprivation that covers the UK, accessed via MySociety. 
  • There is an association between community foundation grants and deprivation, with the most deprived areas receiving the majority of grants (1,388) and the least deprived areas receiving the least amount of grants (291)
  • This relationship remains when examining the proportion of the overall grant funding received. However, there is a very slight discrepancy between areas ranked among the most deprived 30% and 40% (receiving 10.9% and 11.0% of grant funding respectively) and areas ranked among the most deprived 50% and 60% (receiving 8.8% and 9.5% of grant funding respectively).

A graph showing Community foundation grants by level of deprivation

What support is available for community foundations to understand the local context in their area?

We are proud to have been supporting community foundations in their work since 2017, through both our Local Insight platform and needs analysis  through our consultancy work.

Local Insight is a powerful tool for community foundations (and indeed, other grantmakers) – bringing together more than 1,000 neighbourhood level indicators under one roof, ready to explore through interactive maps, reports and dashboards

Local Insight is designed to be easy to use and intuitive so you don’t need to be a statistician to gain useful insights. 

We manage all the data in Local Insight so that you can be confident you are using the most up-to-date data in your work. If you’d like to find out more, book a demo today.

We also work closely with community foundations in a consultancy capacity, supporting organisations to understand need and highlight the key narratives in the local areas. For example, we have worked with Sussex Community Foundation to look into the key challenges faced by Sussex communities in their campaign against poverty.  If you would like to talk through a project with us, get in touch today.


Featured posts

Decorative image with the text "data analysis"

Data analysis

General Election 2024: Voting patterns in England by deprivation and community need

The General Election 2024 changed the political geography of the UK. Labour…
More

Decorative image with the text "Data and resources"

Data analysis

Marmot Principles and neighbourhood level data

The Marmot Review, published back in 2010, still has important implications today…
More

Decorative image with the text "OCSI news"

OCSI news

Announcing Local Insight 2.0, the place-based data platform from OCSI

We are proud to announce that we have successfully redeveloped and launched…
More

Case studies
Data analysis
Featured
Indices of Deprivation
left behind neighbourhoods
OCSI news
Research Projects
Resources and data
Uncategorized