
We have recently added tree cover data to Local Insight. The benefits of accessing green space on human health and mental well-being have become even clearer to us since the COVID-19 lockdowns. Trees, which comprise a vital part of these green spaces offer numerous benefits to individuals and communities. Not only do they offer a natural sanctuary, but they also play a crucial role in resolving environmental concerns like biodiversity loss and climate change. However, green space inequalities are still a widely recognised challenge, where disadvantaged communities are more likely to have inadequate access to green space and its beneficial components like tree cover. We can use measures such as the Indices of Deprivation and The Community Needs Index to assess the extent of these inequalities and the impacts this may have on communities.
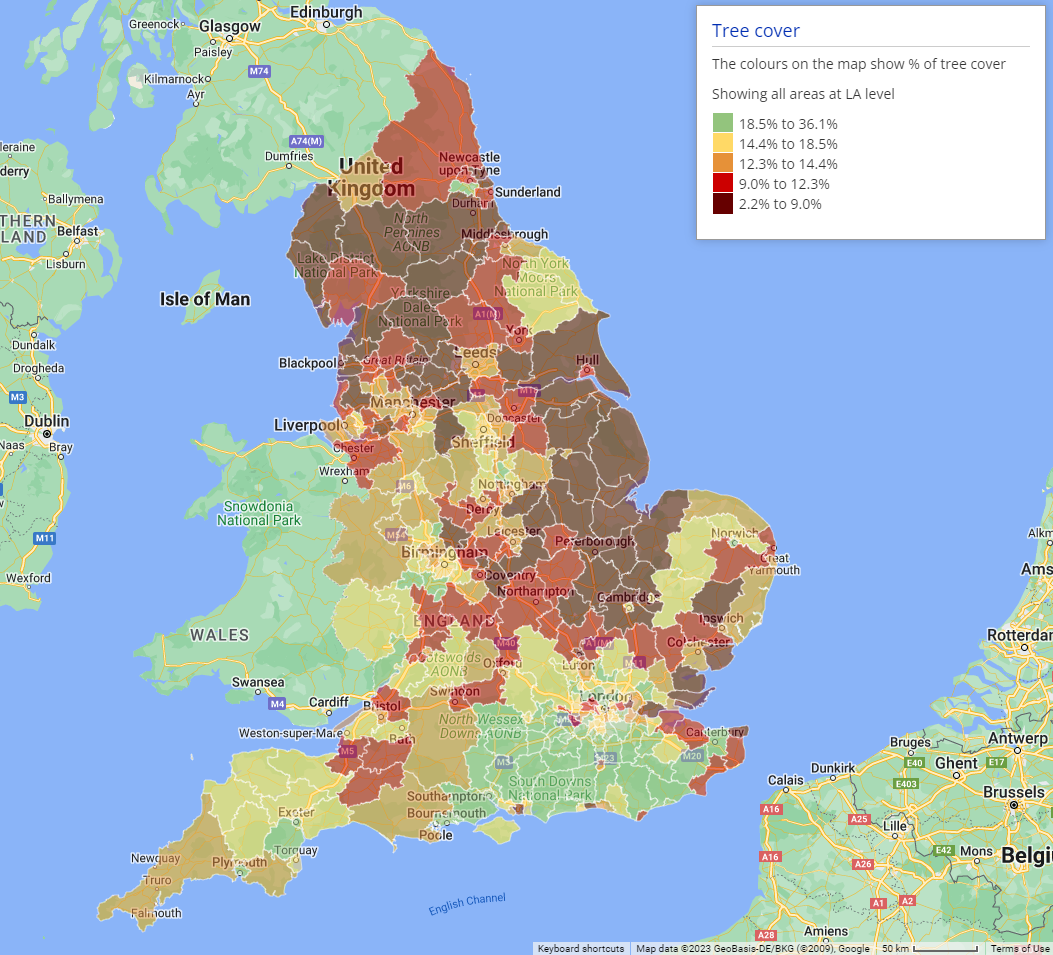
A brilliant new measure of tree canopy cover produced by Friends of the Earth in partnership with Terra Sulis maps tree cover across England and seeks to address these disparities by identifying levels of tree cover in small neighbourhoods and those that are most deprived of trees. We have added this new dataset on ‘Tree cover’ to Local Insight, which can be easily compared to other key indicators to paint a clearer picture of potential environmental inequalities.
The tree cover measure provides the percentage of tree canopy cover down to neighbourhood level (LSOA). The original data is derived from the Environment Agency National LiDAR Programme and Forestry Commission National Forest Inventory 2020 at a 1m spatial resolution. For more information on the methodology, see here.
At the national level, headline analysis includes:
We looked at the 20 neighbourhoods with the lowest levels of tree cover and compared them to the Indices of Deprivation and the Community Needs Index (CNI). We wanted to see where inadequate tree cover may pose more challenges and where dimensions of local need related to deprivation, social and cultural factors may be associated with tree coverage and wider green space inequalities.
| LSOA name | Area type | Tree canopy cover % | IMD Decile (where 1 is most deprived 10% of LSOAs) | CNI score |
|---|---|---|---|---|
| Arun 017A | urban | 0.0002 | 5 | 92.606 |
| Halton 011E | urban | 0.0003 | 4 | 125.751 |
| Halton 011D | rural | 0.0003 | 4 | 125.751 |
| Barrow-in-Furness 010C | urban | 0.0004 | 8 | 97.223 |
| Barrow-in-Furness 007A | urban | 0.0004 | 1 | 69.671 |
| Barrow-in-Furness 007C | urban | 0.0004 | 2 | 104.037 |
| Barrow-in-Furness 007F | urban | 0.0004 | 2 | 104.037 |
| Liverpool 062C | urban | 0.0004 | 8 | 108.788 |
| Isle of Wight 002C | urban | 0.0005 | 5 | 71.243 |
| East Hampshire 006E | urban | 0.0005 | 7 | 55.209 |
| Barrow-in-Furness 008C | urban | 0.0006 | 1 | 69.671 |
| Halton 011B | urban | 0.0006 | 5 | 115.764 |
| Isle of Wight 001B | rural | 0.0006 | 6 | 71.744 |
| Barrow-in-Furness 009E | rural | 0.0006 | 3 | 97.223 |
| Vale of White Horse 009C | urban | 0.0007 | 5 | 123.78 |
| Barrow-in-Furness 007E | rural | 0.0007 | 1 | 81.05 |
| Barrow-in-Furness 010D | urban | 0.0008 | 5 | 97.223 |
| Barrow-in-Furness 008A | urban | 0.0008 | 1 | 70.5 |
| Barrow-in-Furness 007D | urban | 0.0008 | 2 | 104.037 |
| Barrow-in-Furness 008B | urban | 0.0009 | 1 | 69.883 |
We also had a look at the 20 Local Authorities with the lowest levels of tree cover.
| Local Authority | Tree canopy cover % | % neighbourhoods in most deprived 10% nationally | CNI score |
|---|---|---|---|
| South Holland | 2.2 | 0% | 99.094 |
| Boston | 2.3 | 3% | 99.094 |
| Fenland | 2.3 | 4% | 108.789 |
| Richmondshire | 4.3 | 0% | 38.166 |
| City of London | 4.7 | 0% | 0 |
| Craven | 4.8 | 0% | 29.782 |
| North Kesteven | 5 | 0% | 67.18 |
| East Cambridgeshire | 5.2 | 0% | 47.356 |
| Thanet | 5.2 | 20% | 107.863 |
| Barrow-in-Furness | 5.2 | 18% | 82.439 |
| Calderdale | 5.3 | 16% | 67.505 |
| Eden | 5.4 | 0% | 31.782 |
| Rossendale | 5.4 | 12% | 77.917 |
| East Riding of Yorkshire | 5.4 | 5% | 70.187 |
| East Lindsey | 5.4 | 12% | 61.747 |
| Hartlepool | 5.7 | 38% | 120.472 |
| Kirklees | 5.8 | 10% | 80.162 |
| Fylde | 5.9 | 2% | 80.41 |
| Burnley | 6 | 25% | 95.765 |
| Bradford | 6.2 | 28% | 74.174 |
The tree cover indicator compliments a number of other indicators within Local Insight to build a picture of living environment:

The English Community Needs Index (CNI) 2023 is now published as open…
More
Social housing providers have deep, experience-based knowledge of the communities they serve….
More
Many funding programmes use the Index of Multiple Deprivation (IMD) to identify…
More


