The Community Life Survey (CLS) is an annual survey commissioned by the Department for Culture, Media and Sport (DCMS) with the aim of understanding more about community engagement, volunteering and social cohesion. It sampled adults (aged 16+) throughout England.
For the latest release at the time of writing (2023/24), DCMS partnered with the Ministry of Housing, Communities and Local Government (MHCLG). This collaboration enabled a significant boost in sample size, allowing the survey to produce robust and representative estimates at the Local Authority level.
To explore this dataset in greater depth, we’ve combined a handful of Community Life Survey indicators with our own Community Needs Index (CNI) – a multi-dimensional measure of community need. The CNI captures challenges in areas under three domains:
By correlating these indicators with the CLS indicators, we aim to better understand how structural need relates to social outcomes. In particular, we’ve focused on three CLS variables that speak directly to community strength and vulnerability:
These indicators were selected not only because they are key outcomes in their own right, but also because they offer insight into the underlying resilience of local communities – capturing how people connect, contribute, and cope in the places they live. By examining these alongside the CNI, we can better understand how underlying place-based disadvantage manifests in everyday social experience, highlighting where gaps in infrastructure or engagement may leave communities more vulnerable, and where strengths can be built upon.
The correlation matrix below shows how closely each of the Community Life Survey indicators is linked to the overall Community Needs Index rank, as well as the rank on the Active and Engaged Community domain. While the CNI includes three domains, the Active and Engaged Community domain shows the strongest relationships with the CLS indicators. Both the Civic Assets and Connectedness domains display very weak or inconsistent correlations with volunteering, belonging and loneliness.
As such, we’ve focused our analysis on the Active and Engaged Community domain, where clearer patterns emerge, offering the strongest insight into how levels of civic participation and engagement shape social outcomes in local areas. While these relationships don’t prove cause and effect, they highlight important patterns that can inform where support, investment, or further exploration may be most needed.
Note: In the Community Needs Index, a lower rank indicates higher need. As such, a positive correlation with the Active and Engaged Communities rank means that outcomes are typically better in areas with lower need.
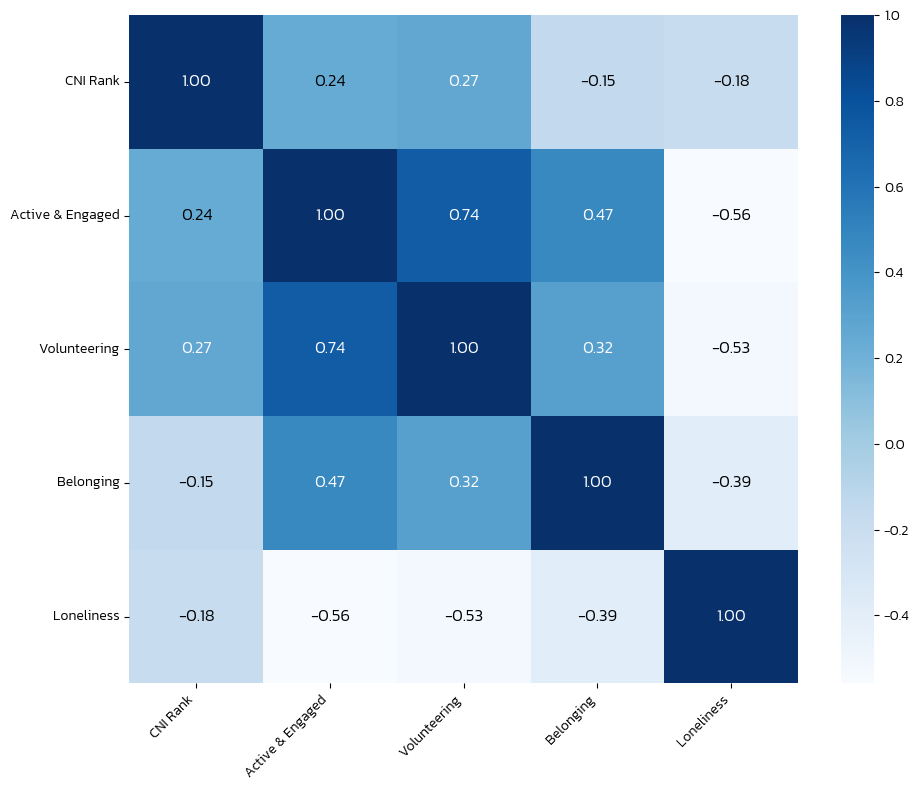
As shown, volunteering shows a clear relationship with the Active and Engaged Community domain. Areas which have a lower rank on this domain (indicating higher overall need) tend to have lower rates of volunteering. This reinforces the idea that where levels of civic participation are lower, opportunities to take part may be limited.
Interestingly, belonging shows a slight negative correlation with overall community need, meaning that areas with higher levels of structural disadvantage actually report slightly stronger feelings of neighbourhood belonging. While the relationship is weak, it suggests that social identity and attachment can persist even in high-need areas, perhaps where communities are tightly knit through shared experience. At the same time, belonging is positively and more strongly associated with active and engaged communities, highlighting the important role of local participation and civic involvement in helping people feel connected to the places they live.
Loneliness shows the strongest relationship with the Active and Engaged Community domain: areas where community participation is weakest are much more likely to report high levels of loneliness. A similar pattern appears in places with lower rates of volunteering and weak feelings of belonging. These findings underline that loneliness is not just a personal experience – it’s a place-based one. Where people feel less able or invited to take part in local life, isolation becomes more common.
Notably, the Community Life Survey indicators correlate with one another too: areas with lower volunteering also tend to report lower belonging and higher loneliness. This clustering of outcomes hints at a deeper web or community resilience or vulnerability, where strengths in one area can reinforce others whilst gaps may compound each other.
To better understand how community need and social experiences combine in different places, we have grouped Local Authorities into three broad clusters. These clusters were based on a mix of Community Needs Index ranks and Community Life Survey outcomes, capturing both the structural challenges communities face and how people are engaging with local life.
Each cluster reflects a distinct combination of need, engagement and connection. Some places may have high need and low participation, whilst others may have lower community need but still experience social disconnection. This kind of typology analysis helps reveal the different realities behind the numbers, and offers a more nuanced way of thinking about where support, infrastructure or investment may be most impactful.
The maps below show the number of people in each Local Authority who live in each cluster, helping us understand how these patterns are distributed across the country.
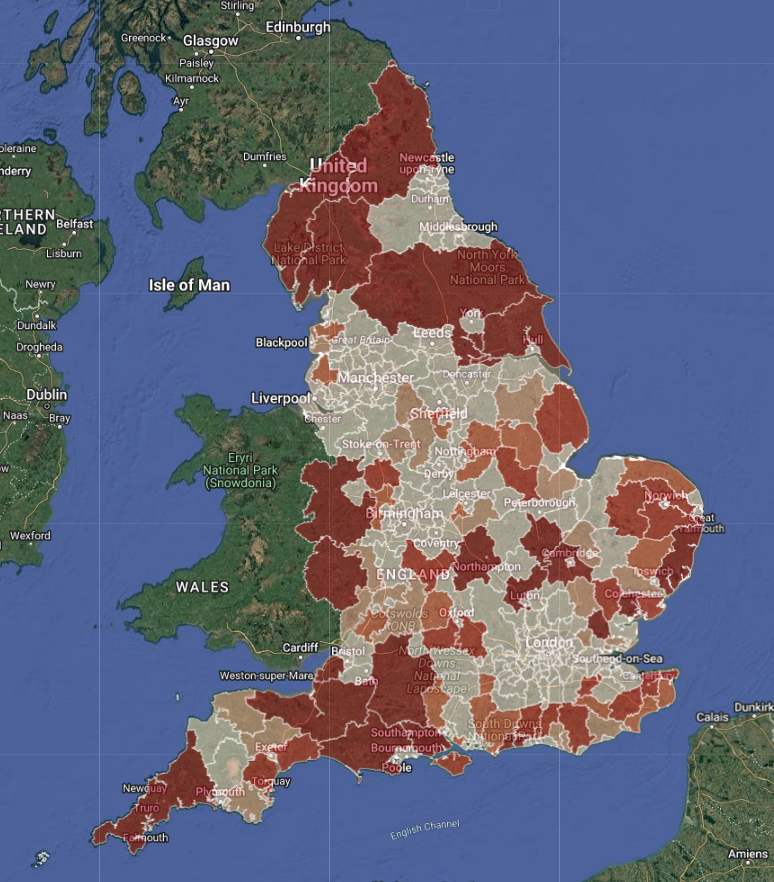
Cluster 1 represents areas with high levels of community need, but where civic engagement and belonging remain strong, highlighting the existence of social resilience even in structurally disadvantaged settings. Tight-knit communities are a defining feature in these areas.
This cluster is the most geographically widespread, found across much of the North, Midlands, coastal areas and parts of the South West. Notable Local Authorities include County Durham, Redcar and Cleveland and Middlesbrough (former industrial areas in the North East with deep-rooted communities), Torbay and Plymouth (coastal authorities in the South West) and Tendring and Great Yarmouth (areas on the East coast of England).
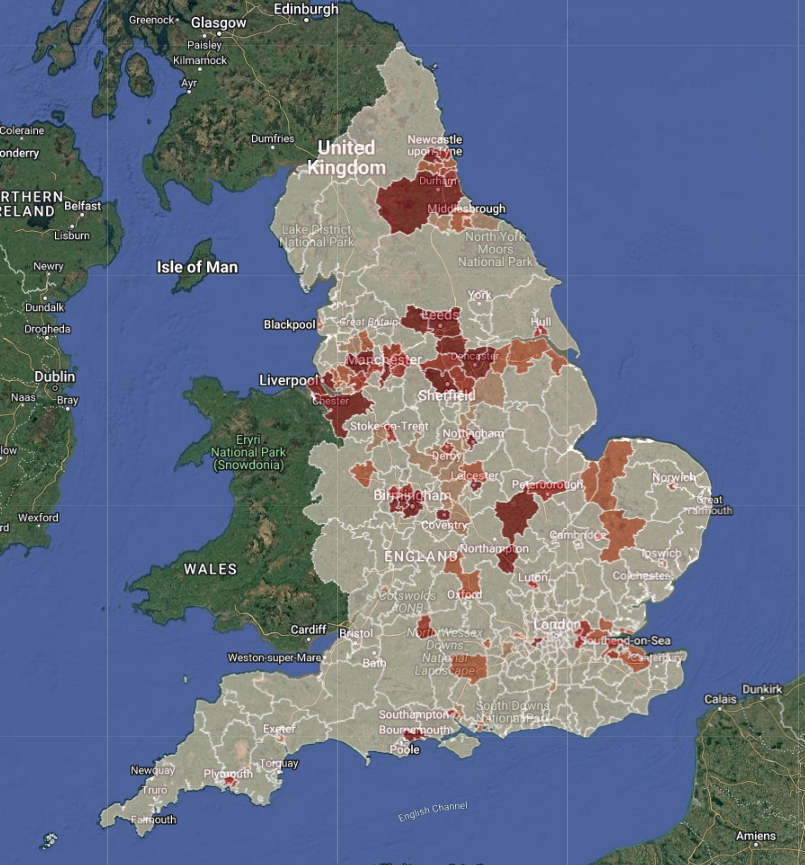
Cluster 2 represents areas which combine moderate structural need with weaker social outcomes, including higher loneliness and lower belonging. These areas may have experienced economic decline or fragmentation, where rebuilding both physical and social infrastructure is needed.
This cluster is less widespread but highly concentrated in key urban and post-industrial areas, particularly in the North West, West Midlands and parts of Yorkshire. Notable Local Authorities include Manchester, Oldham and Rochdale (former manufacturing towns), Stoke-on-Trent and Walsall (urban areas in the West Midlands) and Bradford and Rotherham (diverse, high-density areas).
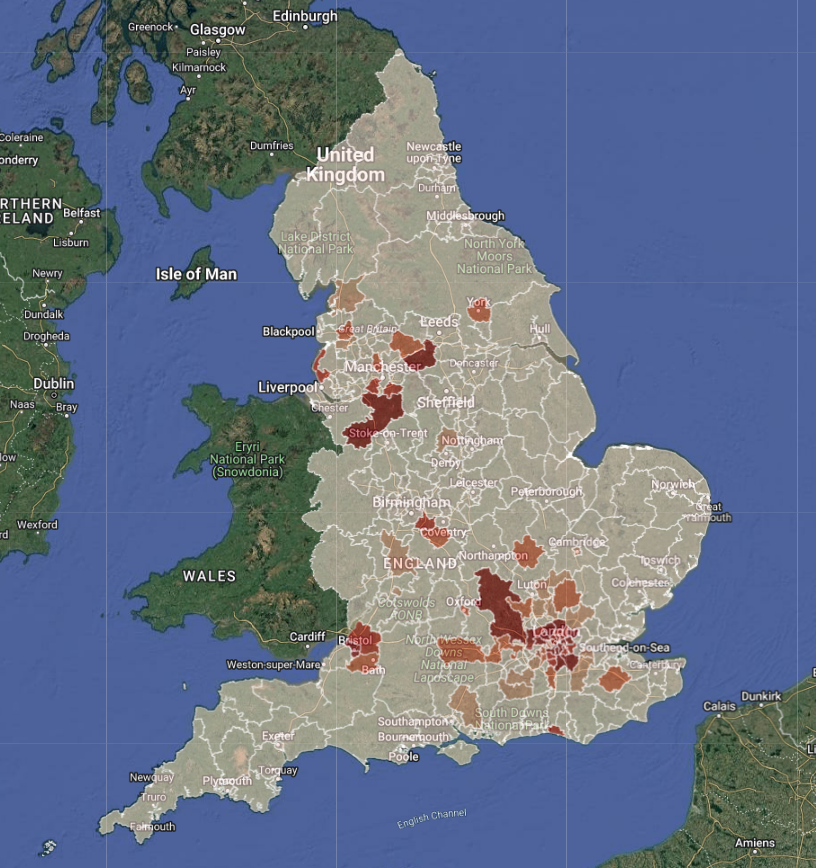
Cluster 3 represents areas which have lower community need and moderate civic outcomes, though not always the most engaged or connected. These areas tend to perform well structurally but may have less visible or formal community participation, perhaps reflecting more individualised or commuter lifestyles.
This cluster is primarily located in the South and East of England, including London’s commuter belt, much of the South East and parts of the East of England. Notable Local Authorities include Wokingham, South Oxfordshire and St Albans (affluent commuter towns), Central Bedfordshire, Chelmsford and East Hertfordshire (semi-rural districts) and Sutton, Bromley and Kingston upon Thames (outer London boroughs).
The maps reveal how community strength and vulnerability do not follow a simple pattern. While community need and engagement often align, there are pockets of resilience in high-need places, and signs of disconnection in low-need ones.
This reinforces the value of a typology approach, highlighting that place-based policy needs to go beyond just deprivation and focus on social infrastructure, belonging and participation – wherever they’re lacking.
All the datasets listed in this blog are available within Local Insight, our place-based data platform. To explore them, using maps and dashboards, compare the neighbourhoods that matter to you, and assess how social infrastructure and social outcomes vary across your area.
Want to explore these indicators for your areas, but you’re not subscribed to Local Insight? Book a demo today and receive a free two-week trial.

The Community Needs Index (CNI) was first developed in 2018 through a…
More
London is often characterised as a city of wealth and opportunity, yet…
More
The Welsh Index of Multiple Deprivation (WIMD) is the official measure of…
More