The English Indices of Deprivation 2025 (IoD 2025) have now been published by the Ministry of Housing, Communities and Local Government (MHCLG).
We’ve created the Local Insight IMD Explorer as a way for you to explore key IoD 2025 data for England through interactive maps at a range of different area levels.
Entirely free to access, the IMD Explorer can help analysts, local authorities, charities and community organisations who want to understand deprivation patterns in their areas through interactive maps and offers insight into key IoD 2025 datasets for a variety of different geographies across England, including:
The IMD Explorer is a ‘stripped-down’ version of our place-based data insight platform Local Insight. On your first visit, you’ll be presented with the Index of Multiple Deprivation 2025 (IMD) rank for all Local Authorities in England.
From here, zoom in to explore local neighbourhoods or pan out to understand regional trends. Each area is colour-coded to show relative deprivation levels, helping you quickly identify areas of higher deprivation. Click the legend on the top right to get a deeper understanding of the data, and how it applies to the areas you’re interested in.
To explore other IoD 2025 datasets, simply click the ‘Data’ button on the left, to view a selection of the key indicators published as part of the IoD 2025, split into useful themes.
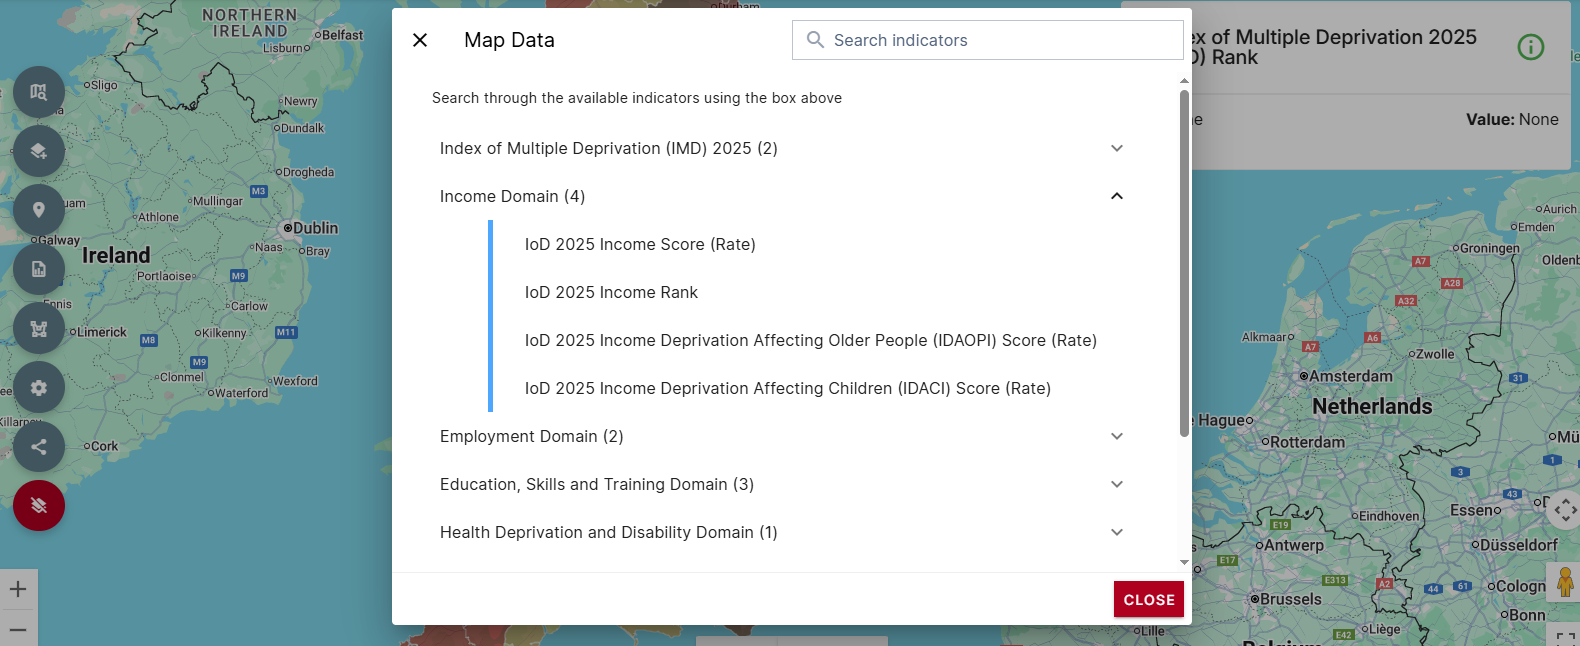
These include the seven domains that make up the Index of Multiple Deprivation: income, employment, education, health, crime, housing, and living environment – along with selected sub-domain indicators where available.
The IMD Explorer showcases just one aspect of the Local Insight platform. With full access to the platform, your organisation can design ‘Custom Areas’ – boundaries that align with your area of interest, no matter the shape or size.
Local Insight can then aggregate any of the IoD 2025 datasets (along with more than 1,500 other indicators) to these Custom Areas – allowing for comparison and analysis of the exact areas you’re working with, through dashboards and reports that are tailored to your audiences. Explore an example “Indices of Deprivation” report within Local Insight here.
To learn more about Local Insight, you can visit our website – or book a free demo to explore how your organisation can use Local Insight to explore IoD 2025 data in full.
Not sure where to start with your own analysis? Pressed for time? The Indices on Demand service is here for you.
Indices on Demand delivers in-depth IoD 2025 analysis with advanced visuals and trusted benchmarks for recognised geographies in England.
Choose your area – Local Authority District, Upper Tier Local Authority, Parliamentary Constituency or Community Foundation Patch – and receive your report instantly.
Your instant report includes
Act fast – don’t lose valuable time building reports from scratch. Download your Indices on Demand report now and be among the first to share key insights with your networks.
View a sample report and buy your report now.

The Community Needs Index (CNI) was first developed in 2018 through a…
More
London is often characterised as a city of wealth and opportunity, yet…
More
The Welsh Index of Multiple Deprivation (WIMD) is the official measure of…
More