The 2025 Index of Multiple Deprivation (IMD) provides an updated view of how deprivation varies across England’s neighbourhoods. For the first time since the 2024 General Election, this allows us to explore how the distribution of inequality aligns with the country’s new political map.
In this analysis, we bring together the latest IMD data and the 2024 election results to understand how deprivation relates to political representation and participation. We look at which parties tend to represent the most and least deprived areas, how deprivation is linked to voter turnout, and how deprivation levels have changed since the previous IMD in 2019. This builds on our previous blog post which explored the relationship between voting patterns, the IMD 2019 and the Community Needs Index (CNI).
For more detailed analysis for Parliamentary Constituencies, take a look at Indices on Demand to help you make sense of the data fast.
The chart below shows the IMD 2025 average Lower-layer Super Output Area (LSOA) rank of constituencies represented by each major party, where a rank of 1 is most deprived and a rank of 33,755 is least deprived. Constituencies ranked below 16,746 fall below the national median, meaning they are more deprived than average.
While there are only a handful of Independent, Reform UK and Green seats (five, five and four respectively), the data still highlights clear differences in deprivation levels across constituencies held by different political parties.
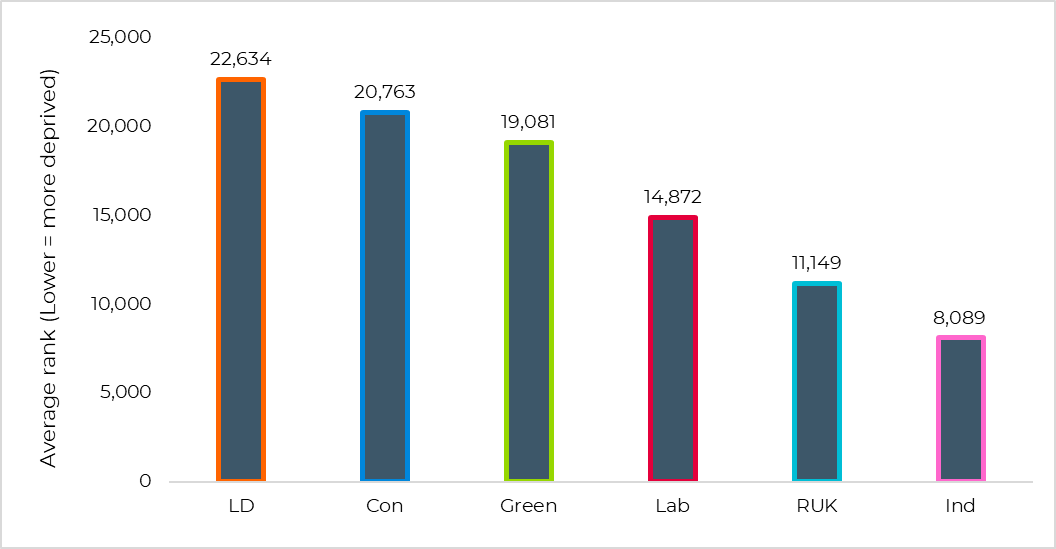
Constituencies held by Independent and Reform UK candidates have the lowest average IMD ranks – 8,089 and 11,149, respectively – placing them well below the national average. Labour-held constituencies also sit below the median, with an average rank of 14,872, while Green constituencies rank slightly higher at 19,081. In contrast, Conservative constituencies have an average rank of 20,763, and Liberal Democrat seats are the least deprived overall at 22,634, more than 14,000 places higher than the average rank of Independent-held constituencies.
Although Independent and Reform parties each hold only a small number of seats, their geographical spread highlights two distinct patterns of deprivation. Independent constituencies are largely concentrated in major urban centres such as Birmingham, Leicester, London, Blackburn and Dewsbury – areas characterised by dense populations and persistent urban deprivation. In contrast, Reform UK constituencies are clustered around coastal and post-industrial areas including parts of Essex, Lincolnshire, Nottinghamshire, and Norfolk, where deprivation often reflects economic decline and limited access to services.
The table below shows the 20 English Parliamentary Constituencies with the highest levels of deprivation on the Index of Multiple Deprivation 2025.
| Constituency | Result | First party | Second party |
|---|---|---|---|
| Bradford West | Labour hold | Labour | Independent |
| Birmingham Hodge Hill and Solihull North | Labour hold | Labour | Workers Party of Britain |
| Birmingham Ladywood | Labour hold | Labour | Independent |
| Birmingham Perry Barr | Independent gain from Labour | Independent | Labour |
| Birmingham Yardley | Labour hold | Labour | Workers Party of Britain |
| Sheffield Brightside and Hillsborough | Labour hold | Labour | Green |
| Birmingham Erdington | Labour hold | Labour | Reform UK |
| Walsall and Bloxwich | Labour gain from Conservatives | Labour | Independent |
| Blackpool South | Labour gain from Conservatives | Labour | Reform UK |
| Bradford East | Labour hold | Labour | Independent |
| Blackley and Middleton South | Labour hold | Labour | Reform UK |
| Liverpool Walton | Labour hold | Labour | Reform UK |
| Wolverhampton South East | Labour hold | Labour | Reform UK |
| Tottenham | Labour hold | Labour | Green |
| Bolton South and Walkden | Labour hold | Labour | Reform UK |
| Gorton and Denton | Labour hold | Labour | Reform UK |
| East Ham | Labour hold | Labour | Independent |
| Tipton and Wednesbury | Labour gain from Conservatives | Labour | Conservatives |
| Liverpool Riverside | Labour hold | Labour | Green |
| Middlesbrough and Thornaby East | Labour hold | Labour | Reform UK |
Labour won 19 of the 20 most deprived constituencies. Of these, 16 were previously held in 2019 and three were gained from the Conservatives. An Independent candidate won the remaining constituency, Birmingham Perry Barr.
It is notable that the Conservative party came second in only one of the 20 most deprived constituencies, with smaller parties and independents being the major opposition to the Labour vote. Reform UK came second in eight of the 20 constituencies, the Greens came second in three constituencies, the Workers Party in two constituencies and Independent candidates in the remaining five constituencies.
Deprivation doesn’t just shape which party wins; it also affects whether people vote at all. The scatter plot below shows the correlation between voter turnout and IMD 2025 rank (where a lower rank indicates higher deprivation).

There is a strong positive correlation (0.84) between deprivation and turnout: people living in less deprived areas are generally more likely to vote, while constituencies with higher levels of deprivation tend to record lower participation rates.
While the overall direction of this correlation may not be surprising, its strength is notable. The data highlights how inequality in England is not only reflected in income, health or education but also in who has a voice in national decision-making. Lower levels of voter registration in more deprived areas also contribute to this pattern, suggesting that the gap in democratic participation may be even wider than turnout figures alone indicate.
The 2025 IMD allows us to see how deprivation has changed since 2019 by comparing each constituency’s IMD decile (where 1 = most deprived and 10 = least deprived). The table below shows how these shifts break down by the winning party in 2024 (with caveats in mind for comparing deprivation trends over time).
Again, it’s worth noting that the Green, Reform UK and Independent parties each hold only a small number of seats, so these percentages reflect changes across a limited set of constituencies rather than wider national trends.
| Overall IMD Decile Change 2019 – 2025 | |||
|---|---|---|---|
| Winning Party 2024 | Less Deprived | Same | More Deprived |
| Labour Party | 26.80% | 55.62% | 17.58% |
| Green Party | 25.00% | 75.00% | 0.00% |
| Conservative Party | 8.62% | 62.93% | 28.45% |
| Liberal Democrats | 7.69% | 73.85% | 18.46% |
| Reform UK | 0.00% | 80.00% | 20.00% |
| Independent | 0.00% | 80.00% | 20.00% |
Labour and Green constituencies are the most likely to have improved, with 26.8% and 25.0% moving to a less deprived decile since 2019. The Green Party also stands out as the only winning party where no constituencies moved to a more deprived decile.
Conservative constituencies show the largest share of areas becoming relatively more deprived, with over 28% moving to a higher deprivation decile since 2019 and only 8.6% showing improvement. In comparison, Reform UK and Independent seats are mostly static or worsening, reflecting areas where deprivation remains deeply entrenched.
Taken together, these findings show that deprivation continues to shape both England’s social and political landscape. Independent, Reform UK and Labour MPs are most likely to represent constituencies with higher levels of deprivation, while Liberal Democrat and Conservative constituencies are generally less deprived. At the same time, voter turnout remains lower in more deprived areas, meaning that those most affected by disadvantage are often least represented in the democratic process.
Although there are signs of improvement in some places, change is slow and uneven. The areas that were most deprived in 2019 remain so today, particularly in coastal and post-industrial regions. Political shifts may happen quickly, but reducing deprivation takes sustained effort over time.
These findings reinforce the importance of using data like the IMD to understand inequality at a local level and to support targeted action – helping decision-makers focus on where challenges remain most persistent and where engagement and investment are most needed.
Our Indices on Demand service is now live – helping you make sense of the data fast with instant, in-depth reports for any of England’s 543 Parliamentary Constituencies, as well as other recognised geographies such as Local Authorities, Upper-Tier Local Authorities and Community Foundation Patches.
Each report brings together the latest Index of Multiple Deprivation (IMD) data, helping you understand how deprivation and inequality shape communities across every part of the country.
Your instant report includes:
Download your Indices on Demand report now and be among the first to share key insights with your networks. View a sample report and buy your report now.
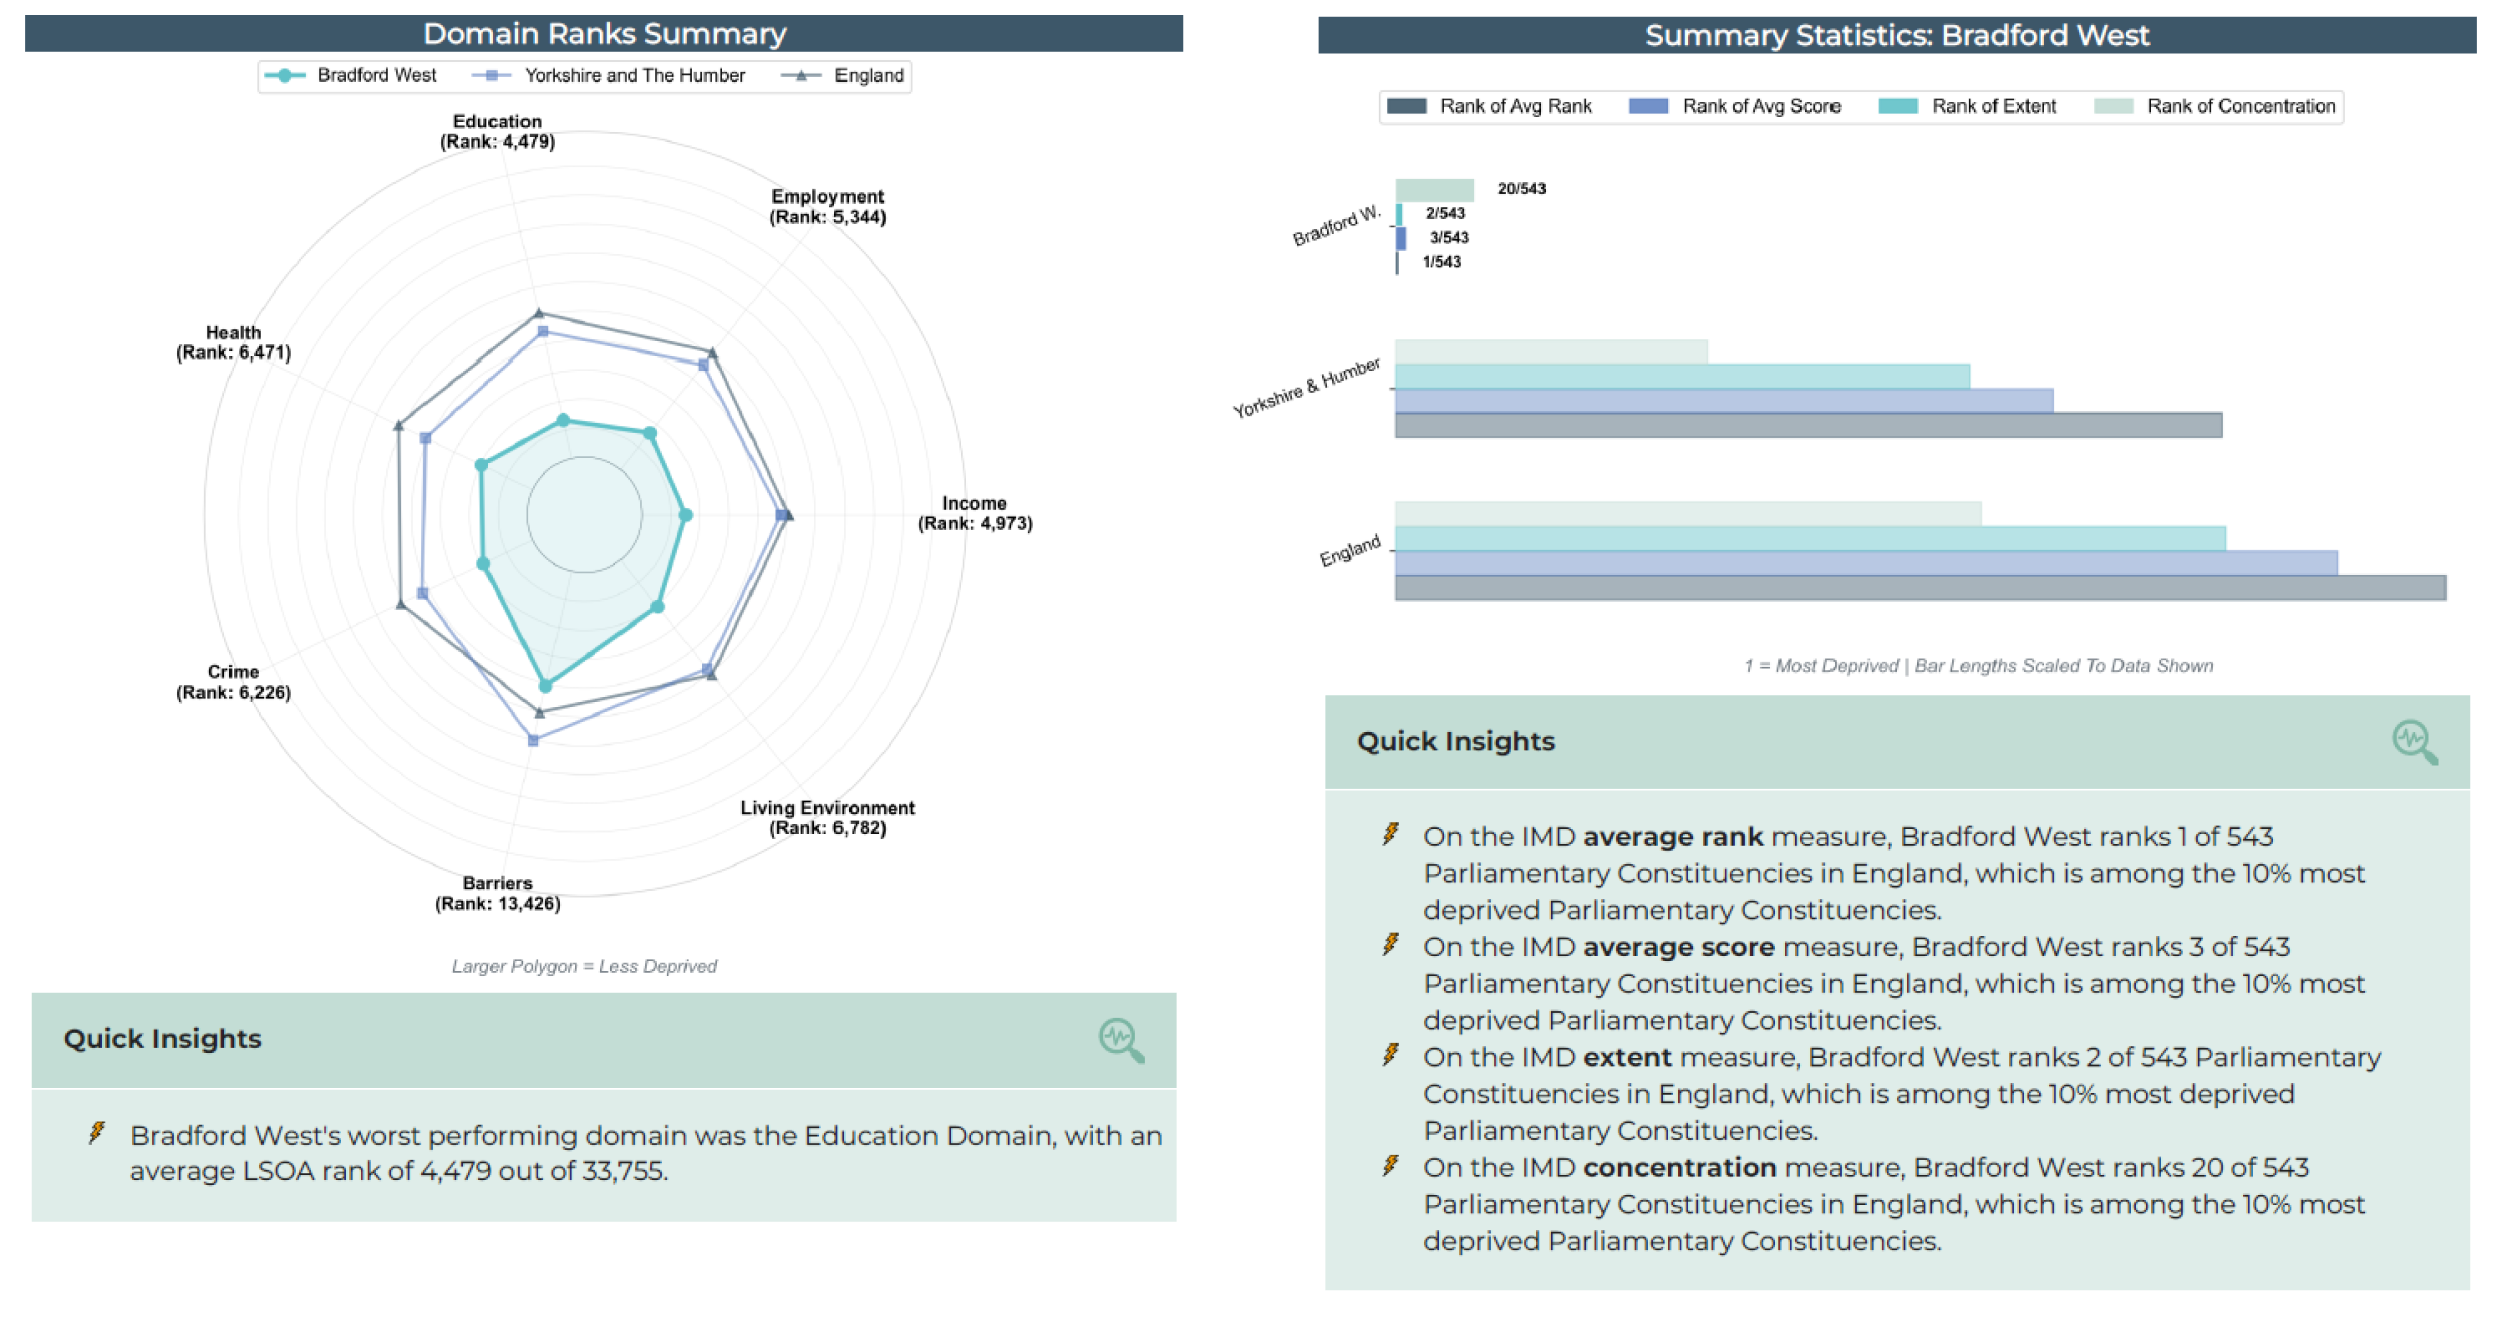
Preview what’s inside for the most deprived Parliamentary Constituency – Bradford West:
All of the 2025 English Indices of Deprivation (IoD) datasets, including the IMD, are also available to explore within Local Insight, our place-based data platform.
Find out more about the data from this analysis below:

The Community Needs Index (CNI) was first developed in 2018 through a…
More
London is often characterised as a city of wealth and opportunity, yet…
More
The Welsh Index of Multiple Deprivation (WIMD) is the official measure of…
More