The Welsh Index of Multiple Deprivation 2025 (WIMD 2025) has now been published and you can explore the WIMD 2025 and each of the eight domains through our Local Insight Wales Explorer.
The Welsh Index of Multiple Deprivation (WIMD) is the official measure of relative deprivation for small areas (LSOAs) in Wales. Similarly to the English Indices of Deprivation, it ranks all small areas in Wales from most deprived (ranked 1) to least deprived (1,917).
The WIMD is a relative measure of deprivation, meaning that you can identify which areas are more or less deprived than others, but not by how much.
The WIMD is an important measure for targeting resources and developing area-based policies. As with all data, it only tells part of the story and is most useful when used together with other information.
WIMD consists of 8 separate domains (or types) of deprivation, each compiled from a range of indicators. Domains are weighted differently to reflect their impact on overall deprivation. Below are the 2025 domains and their associated weightings:
The Local Insight Wales Explorer is a simplified version of our place-based data insight platform Local Insight. On your first visit, you’ll see the Welsh Index of Multiple Deprivation 2025 rank displayed on the map for Unitary Authorities in Wales.
From here, zoom in to explore local neighbourhoods or zoom out to understand national trends. Each area is colour-coded to show relative deprivation levels, helping you quickly identify areas of higher deprivation. Click the legend box, in the top right of your screen to get a deeper understanding of the data, and how it applies to the areas you’re interested in. As you hover over different areas, you will be able to see the data value for that area.
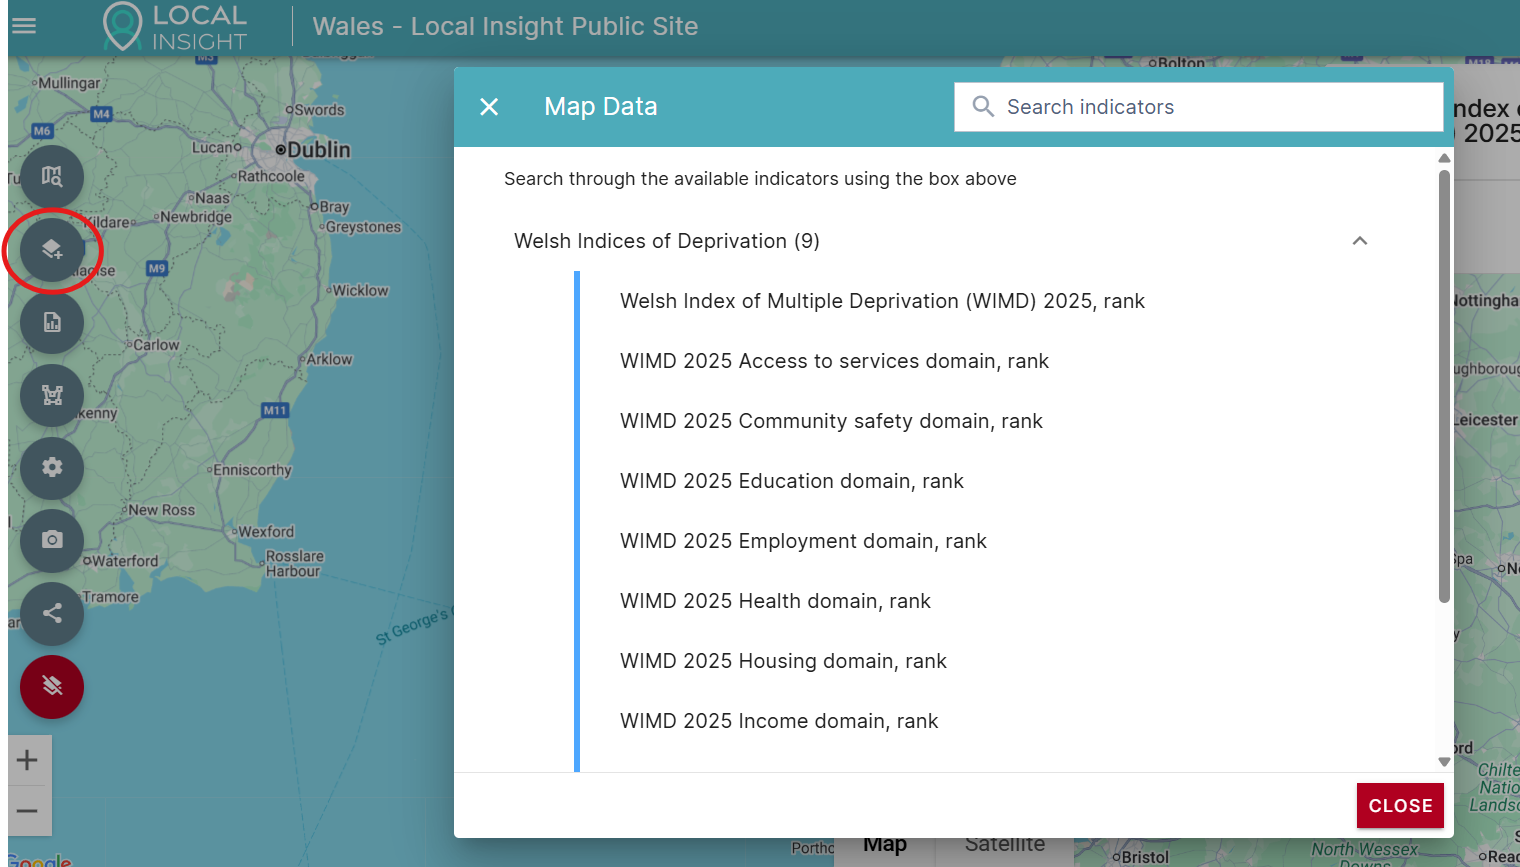
To explore other WIMD 2025 datasets, click the ‘Data’ button on the left, to view each of the eight domains.
The Local Insight Wales Explorer showcases just one aspect of the Local Insight platform. With full access to the platform, your organisation can design ‘Custom Areas’ – boundaries that align with your area of interest, no matter the shape or size.
Local Insight can then aggregate any of the 70 WIMD 2025 datasets (along with more than 1,300 other indicators) to these Custom Areas – allowing for comparison and analysis of the exact areas you’re working with, through dashboards and reports that are tailored to your audiences (explore an example “Welsh Index of Multiple Deprivation” report for Local Insight here).
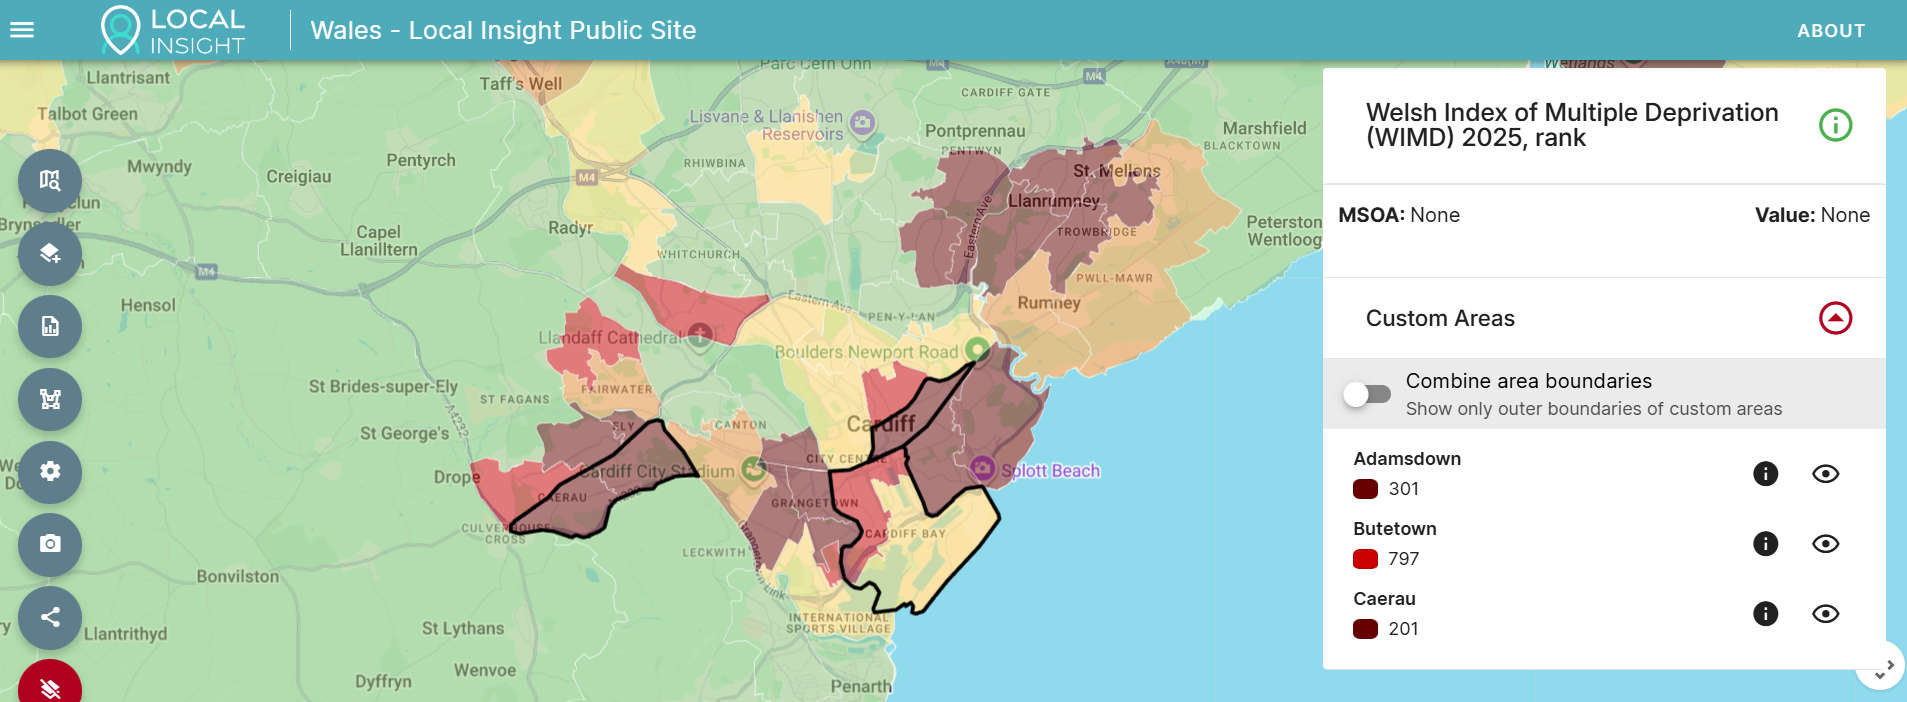
Area boundaries for 3 wards in Cardiff displayed on the map and the data value for each custom area listed on the right.
To learn more about Local Insight, you can visit our website – or book a free demo to explore how your organisation can use Local Insight to explore Welsh Index of Multiple Deprivation 2025 data in full.

The Community Needs Index (CNI) was first developed in 2018 through a…
More
London is often characterised as a city of wealth and opportunity, yet…
More
The Welsh Index of Multiple Deprivation (WIMD) is the official measure of…
More