The Welsh Index of Multiple Deprivation (WIMD) is the official measure of relative deprivation in Wales, widely used to understand inequality and target resources at a local level. The latest release provides an updated picture of how deprivation is distributed across Welsh communities and how this has changed over time.
Using the new WIMD 2025 data alongside analysis in Local Insight, this blog explores three key questions:
While many of the most deprived neighbourhoods in Wales remain unchanged, the latest data also highlights areas where relative deprivation has deepened – often in places already under pressure.
Note: Any changes in relative deprivation between 2025 and previous Indices should be considered in the context of the changes to the methodology, geography and component indicators that have occurred between different versions of the Indices. Therefore, some of the observed changes in this blog may be due to changes to the measurement approach introduced in 2025.
The table below shows the 20 most deprived LSOAs in Wales in WIMD 2025. Rhyl North (Denbighshire 004E) remains the most deprived neighbourhood in Wales, having also ranked lowest in the 2019 WIMD.
More broadly, the most deprived neighbourhoods are highly concentrated in a small number of places, with Rhyl, Ely, Penderry and Townhill each appearing multiple times in the top 20. These communities are largely located in urban and post-industrial areas, particularly in South Wales and along the North Wales coast.
| Area name | Unitary authority | WIMD 2025 rank |
|---|---|---|
| Rhyl North 004E | Denbighshire | 1 |
| Caerphilly East 022E | Caerphilly | 2 |
| Ely East 039E | Cardiff | 3 |
| Caerau 001A | Bridgend | 4 |
| Rhyl South West 006B | Denbighshire | 5 |
| St Mellons West 013D | Cardiff | 6 |
| Caia Park 010C | Wrexham | 7 |
| Ely East 039B | Cardiff | 8 |
| Rhyl North 004D | Denbighshire | 9 |
| Rhyl North 004F | Denbighshire | 10 |
| Penderry 011A | Swansea | 11 |
| Rhymney, Pontlottyn & Abertysswg 001E | Caerphilly | 12 |
| Penderry 011C | Swansea | 13 |
| Hirwaun & Rhigos 001E | Rhondda Cynon Taf | 14 |
| Glyncorrwg & Blaengwynfi 011B | Neath Port Talbot | 15 |
| Gurnos, Trefechan & Pontsticill 008D | Merthyr Tydfil | 16 |
| Ely East 039D | Cardiff | 17 |
| Caerau East 041A | Cardiff | 18 |
| Townhill 019B | Swansea | 19 |
| Townhill 019C | Swansea | 20 |
The map below shows the overall WIMD rank at LSOA level across Wales, with neighbourhoods shaded from the most deprived (dark red) to least deprived (green). Overlaid in black are the LSOAs that have remained in the top 10% most deprived in both the 2019 and 2025 WIMD releases, highlighting areas where deprivation has been particularly consistent over time.
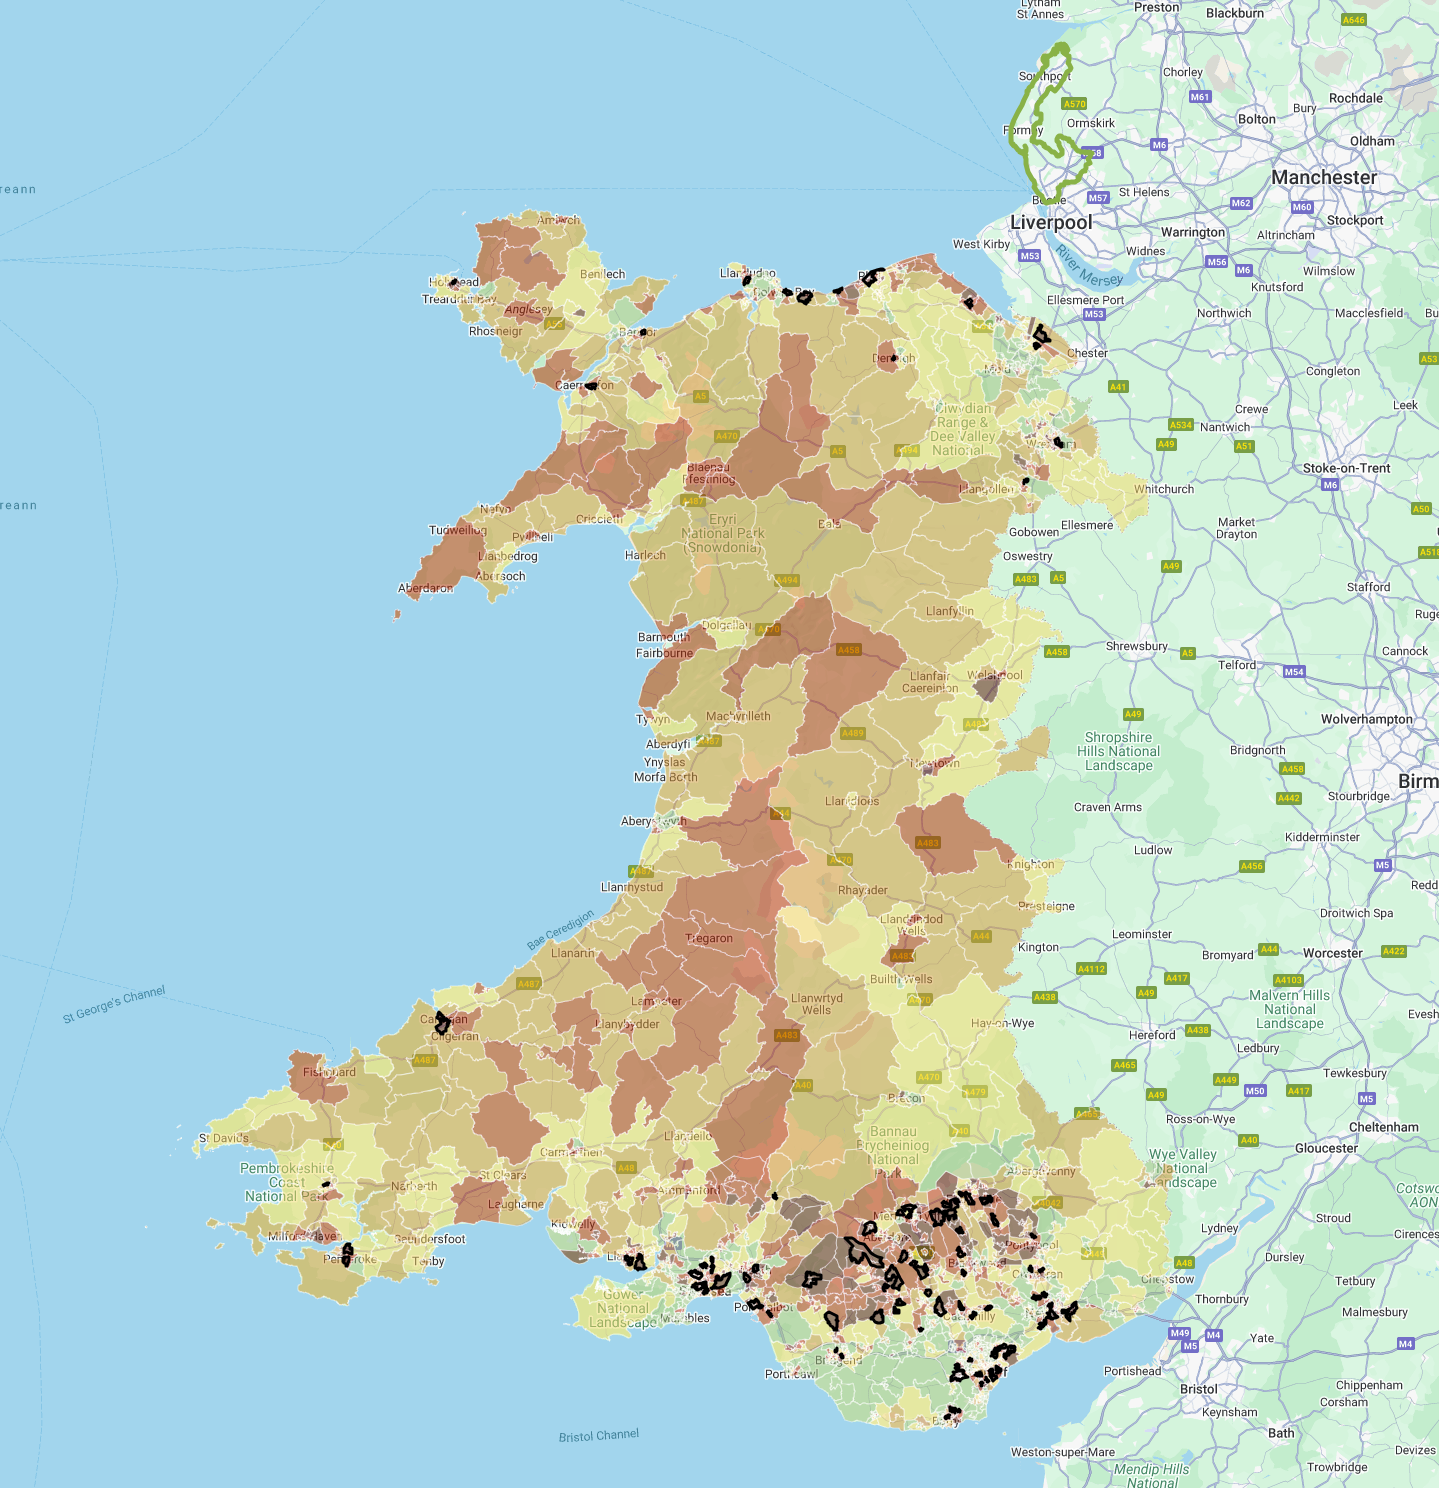
Of the 191 LSOAs in the 10% most deprived nationally, 165 (86.4%) have remained in this group across both the 2019 and 2025 WIMD releases. The largest clusters of persistently deprived LSOAs are found in South Wales, particularly across parts of the South Wales valleys, the larger cities and coastal towns. In these locations, multiple neighbouring LSOAs have remained among the most deprived in Wales, highlighting the long-standing nature of disadvantage in these communities.
Smaller but still notable clusters also appear in parts of North Wales, often centered around coastal towns rather than rural hinterlands. This reinforces the pattern seen in previous WIMD releases: while deprivation exists across Wales, the most persistent forms tend to be concentrated in coastal, urban and post-industrial areas.
By contrast, large parts of rural Wales, particularly in mid and West Wales, show relatively few LSOAs that have remained in the top 10% most deprived across both iterations. This does not mean these areas are free from deprivation, but rather that deprivation in rural areas is more likely to fluctuate in relative terms or to be driven in specific domains (such as Access to Services) rather than appearing consistently among the most deprived overall.
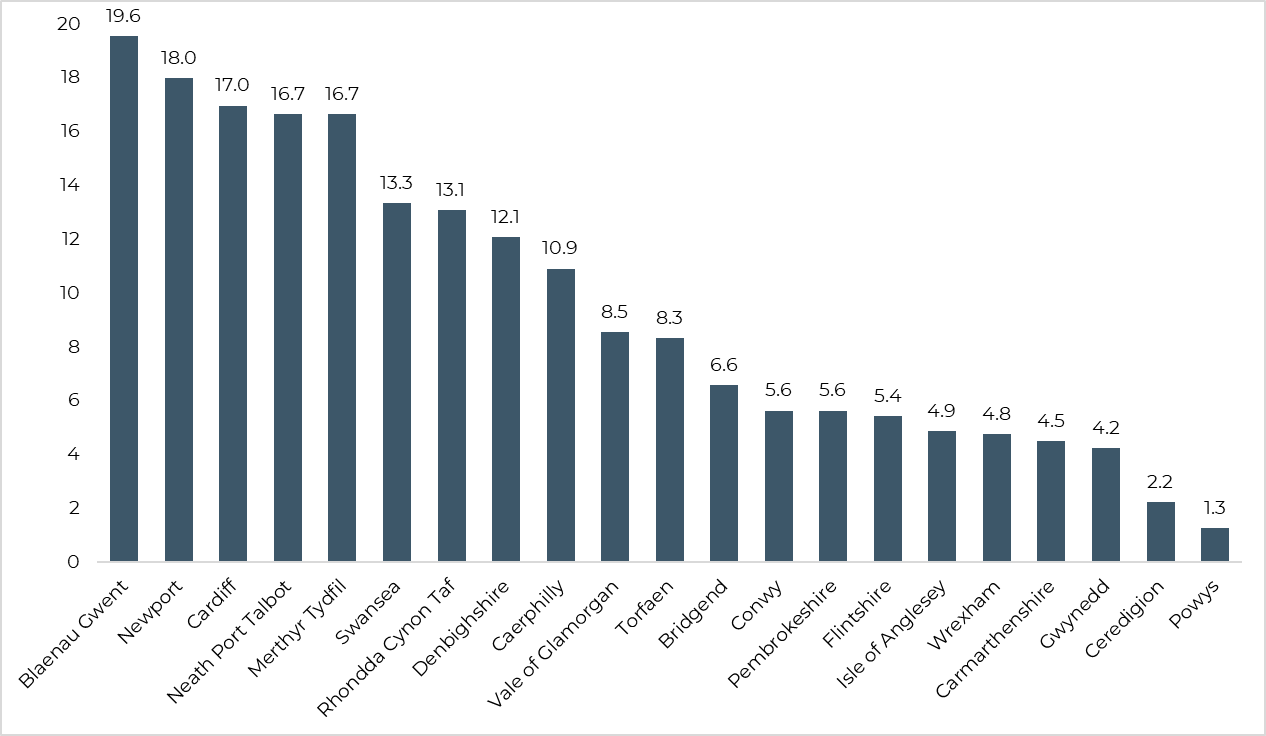
The chart below shows the proportion of each unitary authority’s LSOAs that fall within the 10% most deprived nationally, again highlighting how unevenly deprivation is distributed across Wales. In Blaenau Gwent, almost one in five LSOAs (19.6%) fall within the most deprived decile – nearly double the national benchmark of 10%. Newport (18.0%) and Cardiff (17.0%) also show particularly high concentrations, alongside Neath Port Talbot and Merthyr Tydfil, where around one in six neighbourhoods are among the most deprived.
In contrast, only one LSOA in both Ceredigion and Powys falls within the most deprived 10%, accounting for 2.2% and 1.3% of LSOAs respectively.
The table below shows the LSOAs that have entered the top 10% most deprived in 2025 but were not in this group in 2019. These neighbourhoods were not starting from a position of low deprivation – all were already relatively deprived in 2019, typically ranked between 200 and 300 nationally, but have since fallen further behind other areas in Wales. Several have experienced particularly large relative declines, in some cases dropping well over 100 places in the ranking. This points to intensifying deprivation rather than short-term fluctuation.
| Area name | Unitary authority | 2019 rank | 2025 rank |
|---|---|---|---|
| Mold 016F | Flintshire | 295 | 88 |
| Glyncorrwg & Blaengwynfi 011D | Neath Port Talbot | 210 | 103 |
| Rassau & Beaufort 001B | Blaenau Gwent | 235 | 105 |
| Barry Island 015E | The Vale of Glamorgan | 216 | 120 |
| Penderry 011D | Swansea | 201 | 124 |
| Llanedeyrn 017B | Cardiff | 218 | 126 |
| Bettws 003B | Newport | 204 | 133 |
| Gibbonsdown 007F | The Vale of Glamorgan | 253 | 135 |
| Morriston South 008E | Swansea | 205 | 142 |
| Rassau & Beaufort 001E | Blaenau Gwent | 211 | 148 |
| Neath South 012C | Neath Port Talbot | 199 | 151 |
| Gibbonsdown 007C | The Vale of Glamorgan | 291 | 155 |
| Cockett 017B | Swansea | 229 | 156 |
| Newbridge 010B | Caerphilly | 214 | 162 |
| Neath South 012A | Neath Port Talbot | 221 | 163 |
| West Pontnewydd & Thornhill 009D | Torfaen | 259 | 170 |
| Abersychan 002B | Torfaen | 197 | 175 |
| Oakdale & Pen-twyn 006C | Caerphilly | 251 | 177 |
| Bangor South 002D | Gwynedd | 300 | 178 |
| Holyhead 003F | Isle of Anglesey | 316 | 182 |
| Milford Haven West 012D | Pembrokeshire | 254 | 184 |
| Connah’s Quay North 007D | Flintshire | 225 | 185 |
| Caerau West 045C | Cardiff | 234 | 186 |
| Tonypandy East 018A | Rhondda Cynon Taf | 262 | 187 |
| Sirhowy 003E | Blaenau Gwent | 217 | 188 |
| Ravenhill 013C | Swansea | 207 | 191 |
Many of the neighbourhoods entering the top 10% in 2025 are located alongside areas that have been persistently deprived across successive WIMD releases, suggesting that deprivation is spreading within the same towns and cities rather than appearing in entirely new locations. This is particularly evident in South Wales, where new entries in Swansea (including Penderry, Ravenhill and Cockett) sit within wider clusters of long-standing deprivation, while areas such as Glyncorrwg & Blaengwynfi in Neath Port Talbot and Rassau & Beaufort in Blaenau Gwent reinforce established Valleys patterns. Similar dynamics can be seen in Barry in the Vale of Glamorgan and in towns such as Mold and Connah’s Quay in Flintshire.
While these neighbourhoods have crossed into the most deprived decile, other areas have experienced large changes in rank without reaching this threshold.
Looking across the full distribution of WIMD ranks, some neighbourhoods have experienced particularly large shifts since 2019.
The table below shows the 10 LSOAs that have seen the largest decline in WIMD rank since 2019, indicating a worsening relative position compared to other areas in Wales.
These declines are spread across a range of authorities, but several are located in Cardiff and the Vale of Glamorgan, as well as coastal and market town areas in Gwynedd and Pembrokeshire. This suggests that some of the largest relative deteriorations are occurring outside the areas traditionally associated with the very highest deprivation.
| Area name | Unitary authority | 2019 rank | 2025 rank | Change |
|---|---|---|---|---|
| Cardiff Bay 048E | Cardiff | 1,648 | 715 | -933 |
| Rhoose & Airport 014G | Vale of Glamorgan | 1,493 | 814 | -679 |
| Llanishen 005F | Cardiff | 1,511 | 954 | -557 |
| Pwllheli & Morfa Nefyn 012C | Gwynedd | 1,481 | 946 | -535 |
| Haverfordwest North 005B | Pembrokeshire | 1,311 | 790 | -521 |
| Cardiff Bay 048C | Cardiff | 1,707 | 1,192 | -515 |
| Rhoose & Airport 014F | The Vale of Glamorgan | 1,569 | 1,076 | -493 |
| Bryn-cae & Llanharan 029E | Rhondda Cynon Taf | 1,371 | 885 | -486 |
| Peterston-super-Ely & Wenvoe 003D | The Vale of Glamorgan | 1,692 | 1,210 | -482 |
| Pwllheli & Morfa Nefyn 012B | Gwynedd | 1,574 | 1,098 | -476 |
The table below shows the 10 LSOAs with the largest improvements in rank, indicating a relative move away from deprivation compared to other neighbourhoods.
Many of the largest improvements in relative deprivation are concentrated within a small number of local authorities, most notably Newport, where several neighbourhoods have moved up the WIMD rankings since 2019. This clustering suggests that change is often happening within specific towns and cities, rather than evenly across wider regions. However, these movements occur largely outside the most deprived decile, reinforcing the entrenchment of deprivation at the very bottom of the rankings.
| Area name | Unitary authority | 2019 rank | 2025 rank | Change |
|---|---|---|---|---|
| Duffryn & Maesglas 019E | Newport | 712 | 1,571 | 859 |
| Barry Island 015F | Vale of Glamorgan | 801 | 1,426 | 625 |
| Canton 040F | Cardiff | 786 | 1,408 | 622 |
| Monmouth & Wyesham 004H | Monmouthshire | 1,212 | 1,796 | 584 |
| Rogerstone 009G | Newport | 1,249 | 1,815 | 566 |
| Langstone & Llan-wern 004F | Newport | 913 | 1,469 | 556 |
| St Thomas 021F | Swansea | 484 | 1,010 | 526 |
| Pen-dre, Litchard & Coity 011F | Bridgend | 1,412 | 1,913 | 501 |
| Holt & Rossett 022E | Wrexham | 1,384 | 1,872 | 488 |
| Victoria & Somerton 013G | Newport | 778 | 1,264 | 486 |
These findings reinforce the importance of using data like the WIMD to understand inequality at a local level and to support targeted action – helping decision-makers focus on where challenges remain most persistent and where engagement and investment are most needed.
You can explore WIMD2025 datasets through our Local Insight Explorer for Wales through interactive maps at a range of geographies.
For more detailed analysis about your communities, Local Insight is an intuitive, powerful tool to support your work.
Local Insight holds all the data from WIMD2025 along with 1500+ other local level datasets to help you make informed decisions for your communities.
Book a demo with the team and:

The Community Needs Index (CNI) was first developed in 2018 through a…
More
London is often characterised as a city of wealth and opportunity, yet…
More