The English Indices of Deprivation (IoD) is a suite of measures that can be used to understand neighbourhood level deprivation in England. OCSI were commissioned to update the Indices of Deprivation for 2025, with the team at deprivation.org, by the Ministry of Housing, Communities and Local Government (MHCLG).
We’ve put together this beginner’s guide to the data to unpick just what the IoD is, how it’s related to the Index of Multiple Deprivation (IMD), and how the data can be interpreted.
Deprivation is different from poverty. Where poverty is a lack of financial resources to meet basic needs, deprivation is more multi-faceted and describes a broader lack of something which is considered to be a basic necessity in society.
Since their original publication in 2000, the English Indices of Deprivation (which includes the IMD) have been widely used for targeting resources, policy and strategy, supporting commissioning and exploring inequalities as well as a vital resource for funding bids.
The English Indices of Deprivation (IoD) is the name of the full set of relative measures of deprivation for small areas (LSOAs) across England. The latest update to the IoD was published by MHCLG on October 30th 2025
Within the IoD are seven domains, each constructed from a basket of different data datasets, or ‘indicators’.
These seven domains are:
Along with these seven domains, there are two supplementary income indices. These are:
The Index of Multiple Deprivation (IMD) is the widest-used measure of relative deprivation for small areas in England.
The IMD ranks every Lower-layer Super Output Area (LSOA) in England from most to least deprived (the most deprived area has the rank of 1). England is broken up into 33,755 LSOAs. Within each LSOA, there are between 1,000 and 3,000 people, within 400 to 1,200 households.
The IMD combines information from all parts of the English Indices of Deprivation to offer a relative measure of deprivation – allowing for a direct comparison of ranks. If one area’s rank is closer to 1 than another’s, it is more deprived.
The IMD combines these seven domains into a single measure. The different domains that make up the overall IMD are weighted differently – that means that some of the domains are treated as more important than others. The weighting is as follows:
| Domain | Weight |
| Income | 22.50% |
| Employment | 22.50% |
| Education, skills and training | 13.50% |
| Health deprivation and disability | 13.50% |
| Crime | 9.30% |
| Barriers to housing and services | 9.30% |
| Living environment | 9.30% |
The 33,755 Lower-layer Super Output Areas in England are ranked according to their deprivation score. For each of the neighbourhood-level Indices, the most deprived Lower layer Super Output Area in England is given a rank of 1, and the least deprived a rank of 33,755.
Ranks can straightforwardly be interpreted as showing broadly whether one LSOA is more deprived than another in the country.
Scores are less straightforward to interpret. The scores are used to create the ranks, but they are constructed from the underlying indicators, which have been combined using a range of statistical techniques (see the technical report for more details). These techniques stretch out the most deprived end of the distribution (to ensure there is greater variation in deprivation scores for the most deprived 10% of areas). All this is to say that IoD scores are usually less meaningful on their own than the ranks.
However, for the Income and Employment deprivation domains and the supplementary indices (IDACI and IDAOPI), the scores are meaningful and relate to a proportion of the relevant population experiencing that type of deprivation.
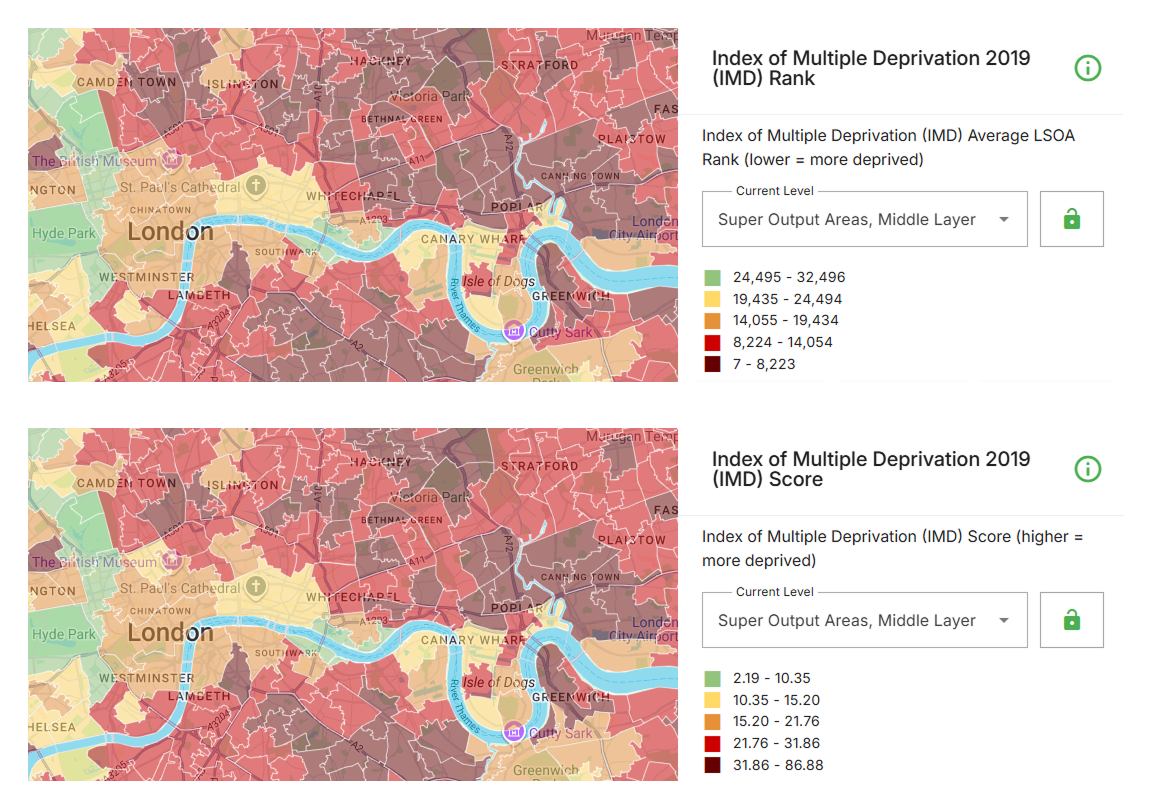
The IMD Ranks and the IMD Scores for MSOAs in Central London, visualised using Local Insight.
The IMD ranks can be grouped into ten equal-sized bands called deciles to make comparison easier.
Decile 1 represents the 10% most deprived LSOAs in England, and decile 10 represents the 10% least deprived.
The IMD can also be split into quintiles (five bands) – allowing you to focus on specific cut-offs such as the most deprived 20% of areas.
The IMD is not produced or published at ward level. Official results are at LSOA level, because the indices are designed for small, relatively even-sized neighbourhoods.
However, you can summarise LSOA-level deprivation for wards using different methods, for example you can:
If you need a ward-level exploration of the deprivation of your area, Local Insight makes it easy to aggregate the IMD from LSOA to wards (and to other boundaries) – presenting the results in consistent and accessible tables, maps and reports.
The indices are a relative measure of deprivation: This means that they can show that one area is more deprived than another – but not by how much. For example, if an area has a score of 40 it is not twice as deprived as an area with a score of 20.
The indices provide a description of areas: This description cannot be applied to all people living in a deprived area. Many non-deprived people live in deprived areas and vice versa.
The indices are not a measure of affluence: Those areas that are not identified as relatively deprived by the IoD are not necessarily affluent areas. The Indices does not capture or compare relative levels of wealth or affluence, so a lower ranked area could be described as less deprived, but not as more affluent or richer.
Changes over time: Changes in deprivation levels over time are relative to other areas. This means you can say that an area has shown increased levels of deprivation, relative to other areas if an area was ranked in the most 20% deprived in 2015 and most 10% deprived in 2019. However, you cannot say that deprivation has increased in that area in absolute terms – it may be that all areas have improved, but this area has improved at a slower pace.
Cross country comparisons: While Indices of Deprivation data is published for each country in the UK and are based on the same concept – there are differences in the domains, indicators, timepoints and geographies on which they are based. This means that the English Indices of Deprivation should not be directly compared with other measures.
Within one day of publication, the IoD and IMD 2025 data will be brought into Local Insight, the place-based data platform from OCSI. Through Local Insight, you’ll be able to explore interactive maps for your custom areas, build dashboards and export charts, data and reports.
MHCLG have also created the Local Deprivation Explorer which allows users to look up deprivation data for their area and explore comparisons across England, with the option to download deprivation data for specific post-codes.

Many funding programmes use the Index of Multiple Deprivation (IMD) to identify…
More
The results of the May 2026 local elections provided plenty to reflect…
More
Local data and evidence on community needs, demographics and outcomes to support…
More