In 2018, Local Trust commissioned OCSI to develop a quantitative measure of ‘left behind’ neighbourhoods (you can read the full publication to find out more about the measure).
As part of this, we developed a Community Needs Index, the first composite indicator of its kind, looking at the social and cultural factors that can contribute to poorer life outcomes.
This is an exploration of the original dataset, published in 2019 – which has since been refined and updated as the Community Needs Index 2023. You can read more about these changes in our summary of the updates.
This data is exclusively available to explore within Local Insight – the place-based data insights platform from OCSI.
Sign up to our Community Needs Index mailing list for all the latest updates and analysis.
The CNI has been created to offer a different perspective to more economically-based measures of local need and has been recognised as a useful measure in and of itself to help policymakers target investment in social infrastructure.
The index has been developed at ward level after significant consultation and debate. The principal reason for selecting wards as the units of analysis as opposed to Lower Super Output Areas (LSOAs) was that wards align more closely with community boundaries and are of a sufficient size to cover locally recognised neighbourhoods. There is, of course, a potential risk that this can mask variations in community need at a very local level. We have run the same analysis at LSOA level and the results are broadly consistent with the ward level data.
The index covers 19 indicators, across three domains;
For a more detailed look at the indicators included within the CNI, please have a flick through the slides below.
Subscribers to Local Insight are exclusively able to explore this data for their areas.
We have included four new datasets in Local Insight; the scores for each individual domain and the overall CNI.
In each case, a higher score indicates higher levels of community need.
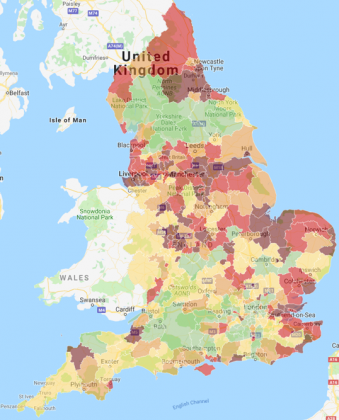
Local Authorities with the highest concentrations of Community Need can be found in the East of the country, particularly around the agricultural Fen areas near the Wash, the industrial areas of the East Midlands and South Yorkshire, and County Durham and in the Thames Gateway and coastal communities throughout England.
By contrast, the lowest levels of Community Need are typically found in areas in and around London, University towns and rural areas of Northern England around the major National Parks (Lake District, Yorkshire Dales and North York Moors).
There is a strong relationship between deprivation and Community Need, with the 10% of wards with the highest levels of Community Need having the highest average deprivation score (30.1). This relationship is consistent across the decile groups (i.e. on average, the higher the level of Community Need, the higher the level of overall deprivation).
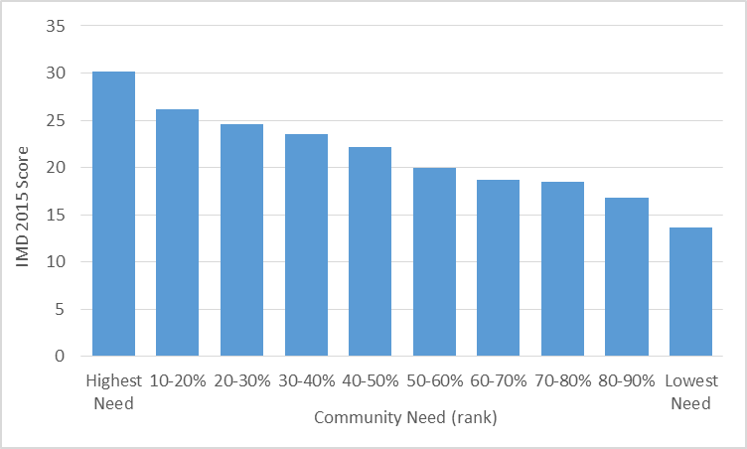
Chart compares average levels of deprivation against overall levels of Community Need.
However, there are a large number of areas where this relationship does not hold as strong. The chart shows that while there is a positive relationship between Community Need and levels of deprivation, there are a large number of areas classified as having high levels of Community Need and low levels of deprivation and vice versa.
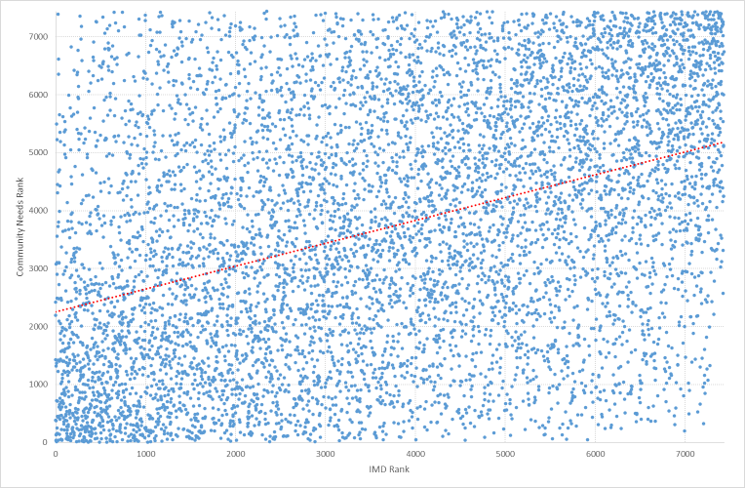
Chart shows the IMD score and Community Needs score for each individual ward in England.
There are:
A subscription to Local Insight gives you instant access to more than 1500 local level datasets (including the Community Needs Index).
You can create any bespoke areas that you like, from wards to GP localities and service catchment areas. All of the data is aggregated to these areas, ready for you to explore through maps, dashboard and reports.
Local Insight is designed to be easy to use and intuitive – so you don’t need to be a statistician to find the contextual information about the communities you work with.
If you’d like to find out more about how a subscription could work for you, sign up for a demo and one of our team will be in touch.
Full report and analysis: ‘Left behind? Understanding communities on the edge’

The Community Needs Index (CNI) was first developed in 2018 through a…
More
London is often characterised as a city of wealth and opportunity, yet…
More
The Welsh Index of Multiple Deprivation (WIMD) is the official measure of…
More