Looking to better understand the statistical geographies that place-based data is published at in Scotland? They can differ in terminology from England and Wales, so between the three countries, things can quickly get confusing. To clear things up, we’ve put together a short guide that’ll explain the differences!
Before we dive into the different geographies, it’s important to understand that place-based data is any data that can be used to better understand an area. That includes Census data, the Indices of Deprivation, or more specific datasets such as the prevalence of loneliness or the amount of green space per local area. All of this can be explored within our Local Insight platform, and you can take a look at selection of the data we hold on our public site.
Statistical geographies are based on population density, using population data from the latest census. This means that each geography will contain approximately the same number of people – we’ve specified the range of people included below. Whether you’re looking at a dense city area, or a sparsely populated rural area, you’ll be able to make like-for-like comparisons between them.
In this blog, we’ll be having a look at some of the key differences between these countries, and why. If you’re feeling unfamiliar with English statistical geographies, our guide here is a good place to start!
Population: 50 – 300 people
England / Wales Equivalent: Output Areas
Population: 100 – 625 people
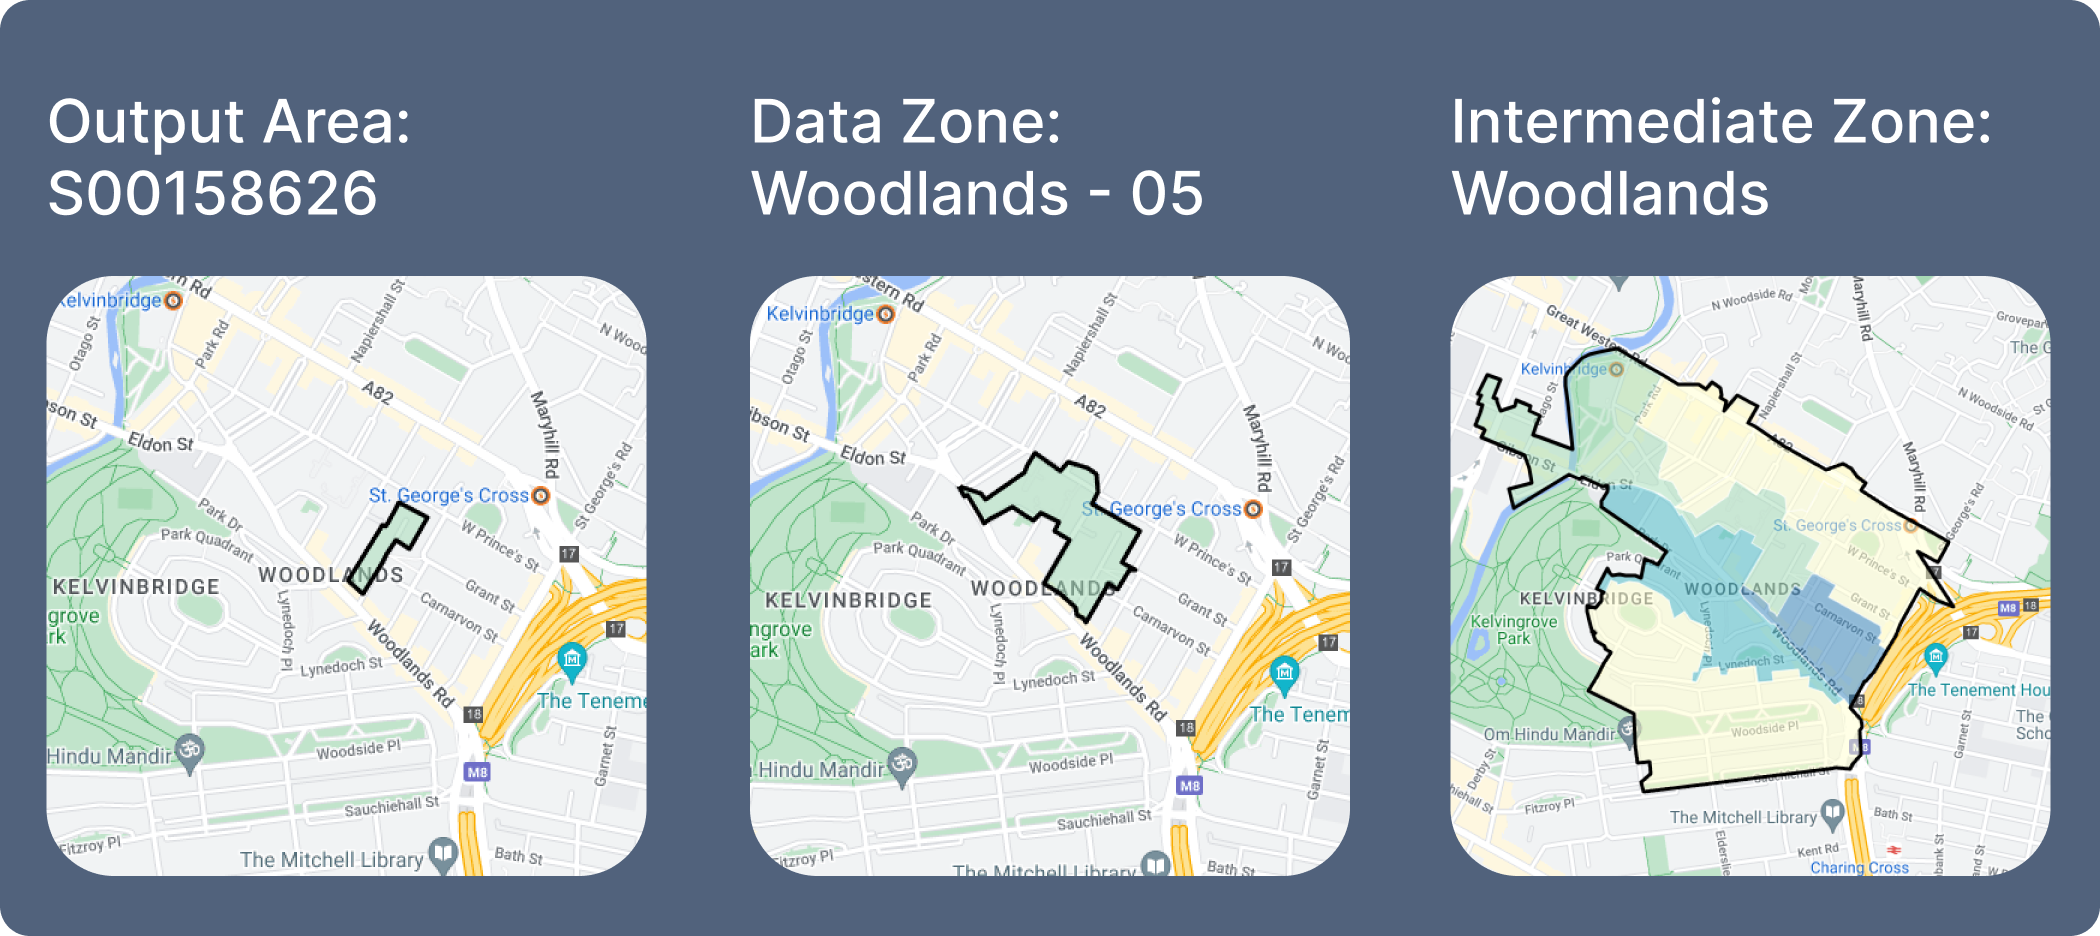
Output Areas are the smallest size of statistical geography you’ll find in Scotland – it’s worth noting that the England / Wales equivalent areas are also defined as Output Areas, though they represent a larger number of people. Census data is typically outputted at this level, allowing for extremely granular analysis between neighbourhoods. However, there is a lack of data published at OA level due to privacy and confidentiality concerns. Because of this, data at OA level is often suppressed to retain anonymity.
Population: 500 – 1000 people
England / Wales Equivalent: Lower Layer Super Output Areas (LSOAs)
Population: 1,000 – 3,000 people
Data Zones are the statistical geography typically used for small-area statistics and datasets in Scotland. Data is often published at this level by government departments, for example, regular datasets like monthly Jobseekers Allowance claimants figures by the Department for Work and Pensions. This is also the size of geography that tends to be used for socio-economic analyses such as the Scottish Index of Multiple Deprivation, or equivalent English Indices of Deprivation (now being updated for 2025).
Population: 2,500 – 6,000
England / Wales Equivalent: Middle Layer Super Output Areas (MSOAs)
Population: 5,000 – 15,000 people
Intermediate Zones in Scotland and MSOAs in England serve similar purposes, being used for broader regional analysis, often for health assessment, public service delivery, and resource allocation. The Scottish Community Needs Index (CSNI) is also published at an Intermediate Zone level, compared to the English CNI which is published at an LSOA (Data Zone equivalent) level.
In England/Wales, the primary datasets published at MSOA level include the Business Register and Employment Survey (BRES) data published by the Office for National Statistics (ONS) , covering types of businesses and their amount of revenue.
| Geography | Population Range | Number of Households |
|---|---|---|
| Scottish Output Areas vs Output Areas (England & Wales) |
50–300 residents vs 100–400 residents |
20–125 households vs 40–250 households |
| Data Zones vs Lower Layer Super Output Areas (LSOAs, England & Wales) |
500–1,000 residents vs 1,000–3,000 residents |
200–500 households vs 400–1,200 households |
| Intermediate Zones vs Middle Layer Super Output Areas (MSOAs, England & Wales) |
2,500–6,000 residents vs 5,000–15,000 residents |
1,000–2,500 households vs 2,000–6,000 households |

The National Records of Scotland (NRS) is a Non-Ministerial Department of the Scottish Government, and stores a host of information including historic and up-to-date datasets for you to download and explore. It also includes statistical analysis and reporting done on datasets by the NRS themselves, for example Scotland’s Population 2023, released in both a PDF report, and the raw data in a downloadable format.
If you want to find out more about how Output Areas fit into Data Zones and Intermediate Zones, you’re able to access a full csv list here. This is included in a list of other geography lookups for converting 2011 Output Areas, which are used in Scotland, to any more up-to-date boundaries.
The ONS Open Geography Portal has all kinds of boundaries on it to explore, and download. This includes up-to-date information about statistical geographies, as well as historic information about older boundaries, and other boundary types such as ICBs.
Any of these can be downloaded as a GEOJSON filetype, and uploaded to Local Insight to be mapped out interactively.
Having familiarised yourself with different boundary types and their meanings, you can now quickly and easily explore them using Local Insight.
Our platform Local Insight allows you to set up your own custom areas, which you can save and come back to for easy repeat analysis of the areas that matter most to you. Select from standard geographies, such as intermediate zones or data zones, or create a specific area that’s meaningful to you by drawing it straight onto the map – read more here.
Get access to over 1,500+ maintained and curated indicators to explore these custom areas with, saving you time and data headaches. If that sounds interesting, please get in touch to book a demo, including a 2-week trial of the platform.
London is often characterised as a city of wealth and opportunity, yet…
More
The Welsh Index of Multiple Deprivation (WIMD) is the official measure of…
More