Parks and other green spaces are part and parcel of everyday life for most people, with 91% of people in England using them to “some extent” and 42% using these spaces at least once a week.
Research into green spaces highlights numerous lifestyle and environmental benefits, and advocate them as crucial aspects of urban planning. The use of parks and green spaces can significantly improve both physical and mental health, encourage community cohesion and improve air quality. Given the far-reaching benefits, deeper knowledge of the green spaces in local areas could be be a powerful tool to inform policy decisions.
We have recently added Greenspace data into our community mapping and reporting tool, Local Insight to sit alongside a further 1,100 local level datasets, matched to the areas you care about.
Read on for a bit more detail on the data; and how Greenspaces data in conjunction with Local Insight could support evidence based decisions for public health, community engagement and environmental justice.
The data has been taken from Ordnance Survey’s Open Greenspace data. The data depicts the location and extent of spaces such as parks and sports facilities that are likely to be accessible to the public. The data is already being put to good use, for example in a project that identifies clear air for city cycling and walking.
The full technical specification and product guide are available online for the data enthusiasts among us!
We used this data and converted it into a dataset that is more compatible with Local Insight. The data in Local Insight show you the percentage of a geography’s area that is greenspace.
Converting the data involved a little bit of data magic. The Ordnance Survey data comes in the form of shapefiles – records of the latitudes and longitudes of the boundaries of the greenspaces in the UK. We overlaid this data with the boundaries of Output Areas, also available as shapefiles. To illustrate this process, we have plotted the green spaces and Output Areas in Oxford, using Open Street Map as a background.
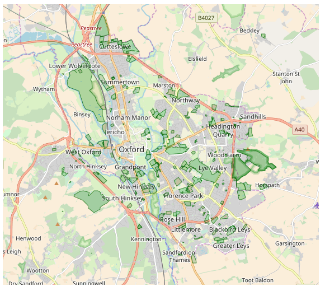
Green spaces in Oxford
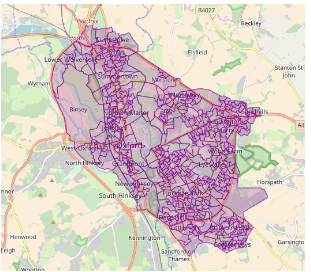
Output Areas in Oxford
By overlaying the two sets of shape files on top of one another, we get a new set of shapes that are the intersection between the Output Areas and the green spaces. The area of the new set of shapes give the area of green space per Output Area. From there, it is simply a question of aggregating this data to higher geographies and dividing by the total area to get the percentage.
We will be putting a “How To” guide together for this process in the coming weeks, watch this space!
There are now two greenspace datasets in Local Insight showing:
Are there other specific breakdowns of the green spaces data that you are interested in? Get in touch and we will see what we can do.
The data by itself is fascinating, and its primary purpose is to enable members of the public to find and access green spaces near them for exercise and recreation (which can be explored through this interactive tool!).
Above and beyond this, the data can be used alongside other demographic and contextual data about a local area, to inform decision making.

[Click to enlarge] Using the dashboard in Local Insight you can highlight for example, areas with a relatively large amont of greenspace and with comparatively low level of participation in regular exercise.
Within Local Insight it is possible to create a dashboard, which includes the green spaces data and a number of health related indicators to highlight areas where for example, there is a large amount of green space and negative correlation with health indicators.
Once these areas have been highlighted, all the relevant services within that area could be plotted on a map and used as a starting point for conversations around improving or adding new services to encourage better use of green spaces.
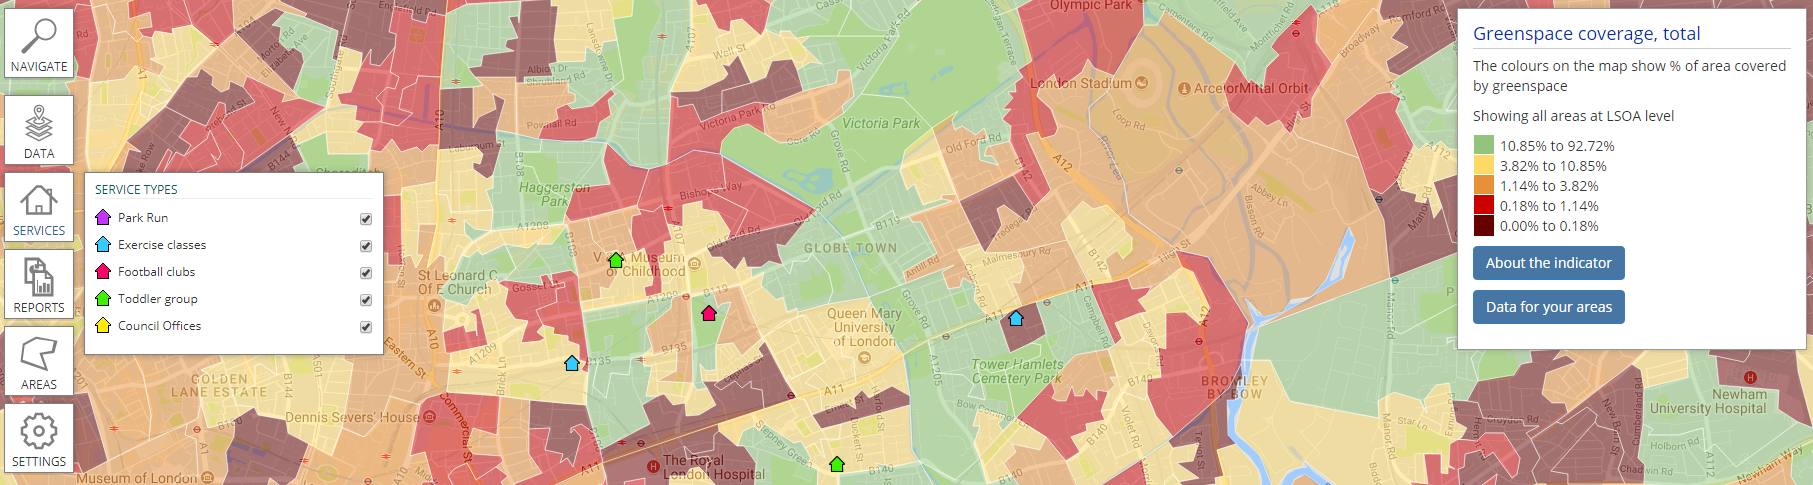
Plot the location of your local services to see whether service provision matches need – and to highlight where you may be able to target resources more effectively.
Maas et al found less green space in people’s living environment coincided with feelings of loneliness and a perceived shortage of social support. Green spaces provide a platform to run events and activities such as urban farming or competitions, which draw in the local community. Promotion of the use of, and access to, local green space has been linked to improvements in community cohesion as well as self-expression, increased skills (e.g. in gardening) and confidence. Given recent headlines that loneliness is as bad for health as long-term illness, better use of green spaces could help to tackle social isolation issues.
Overlaying indicators within Local Insight (such as green spaces, prevalence of loneliness or community dynamics) with an organisation’s own data, can provide some interesting insights into service provision balanced against service need.
Living in a clean and healthy environment is everyone’s right. Globally, certain groups of people (often the most vulnerable people with the least power and money) see these rights denied on a daily basis. Addressing these inequalities is part of what makes up environmental justice.
When looking at the UK context, research shows that if you live in a deprived inner-city area, you have access to five times fewer public parks and good-quality general green space than people in more affluent areas. Furthermore, in areas where more than 40% of residents are from BAME backgrounds, there is 11 times less green space than in areas where residents are largely white.
Above, we have looked at the positive impact access to quality green space can have upon health, wellbeing and social relationships. Therefore, addressing the disparity in access to green spaces could be instrumental in helping to address inequalities in other areas. Indeed, the Mitchell & Popham research referenced earlier indicates the role of green space in helping to reduce health inequalities between rich and poor.
Understanding the local context is paramount in being able to appropriately address inequalities and target resources most effectively. The green spaces data used alongside the wealth of information available from Local Insight could be a useful, timesaving tool in highlighting key areas and identifying areas for attention.
To see for yourself how Local Insight can provide you with instant access to the local knowledge that you need, sign up for a free trial now.
https://www.designcouncil.org.uk/sites/default/files/asset/document/community-green-full-report.pdf
https://www.actionsustainability.com/news/309/Why-green-space-matters-for-health-and-wellbeing/
Urban green nation: building the evidence base CABE, 2010

Following the release of the second Everybody needs good neighbourhoods report, Stefan…
More
We are proud to have contributed towards the Everybody needs good neighbourhoods…
More
The Community Life Survey (CLS) is an annual survey commissioned by the…
More