The General Election 2024 changed the political geography of the UK. Labour won in areas it had never previously held, while the Liberal Democrats made progress in traditional Conservative strongholds. There were breakthroughs and record vote shares for the smaller parties of UK Reform, the Green Party and Plaid Cymru, as well as an unprecedented success for independent candidates. While there has been lots of exploration of the regional changes brought about by the election – it is also interesting to consider whether there are any socio-demographic differences between areas where the different political parties have found electoral success.
To explore this question we have aggregated the Index of Multiple Deprivation 2019 and the Community Needs Index 2023 to Parliamentary Constituency level, so that we can compare levels of socio-economic and social infrastructure challenges across different constituencies. Here, we explore whether we can identify any differences between voting patterns and levels of deprivation and community need.
The Index of Multiple Deprivation (IMD) is the official measure of socio-economic deprivation in England. The IMD is an important tool used by national and local organisations to target resources, develop policy and support decisions about addressing local needs. More specifically, the IMD is used to set a range of national and local government strategies and service planning, including helping understand current need and model future demand for services. Third sector and community organisations also use the IMD to target their services. Indeed, the English Indices of Deprivation 2019 web page, is the most frequently visited MHCLG statistics page and one of the most visited statistics pages across the GOV.UK website.
The Community Needs Index (CNI) is a small area measure of areas lacking social infrastructure or social capital. The index captures the lack of civic and community assets and spaces to meet, poor connectedness and social isolation and lack of civic participation and third sector activity. The CNI has gained wide usage, for example, it was cited as a measure of Social Capital in the Levelling Up White Paper and has been used as a component in supporting the distribution of a range of levelling up programmes including the DCMS Know Your Neighbourhoods Fund, while Sport England are using the CNI as part of their targeting formula for their new £250m Local Development Partnership.
Note: both of these Indices cover England only, so we have only been able to consider the election results in English Parliamentary Constituencies.
The chart below shows the average IMD rank and average CNI rank across all Parliamentary Constituencies in England – by winning political party. A lower rank = higher deprivation/community need, with ranks of below 16,877 indicating higher levels of deprivation/community need than the national average.
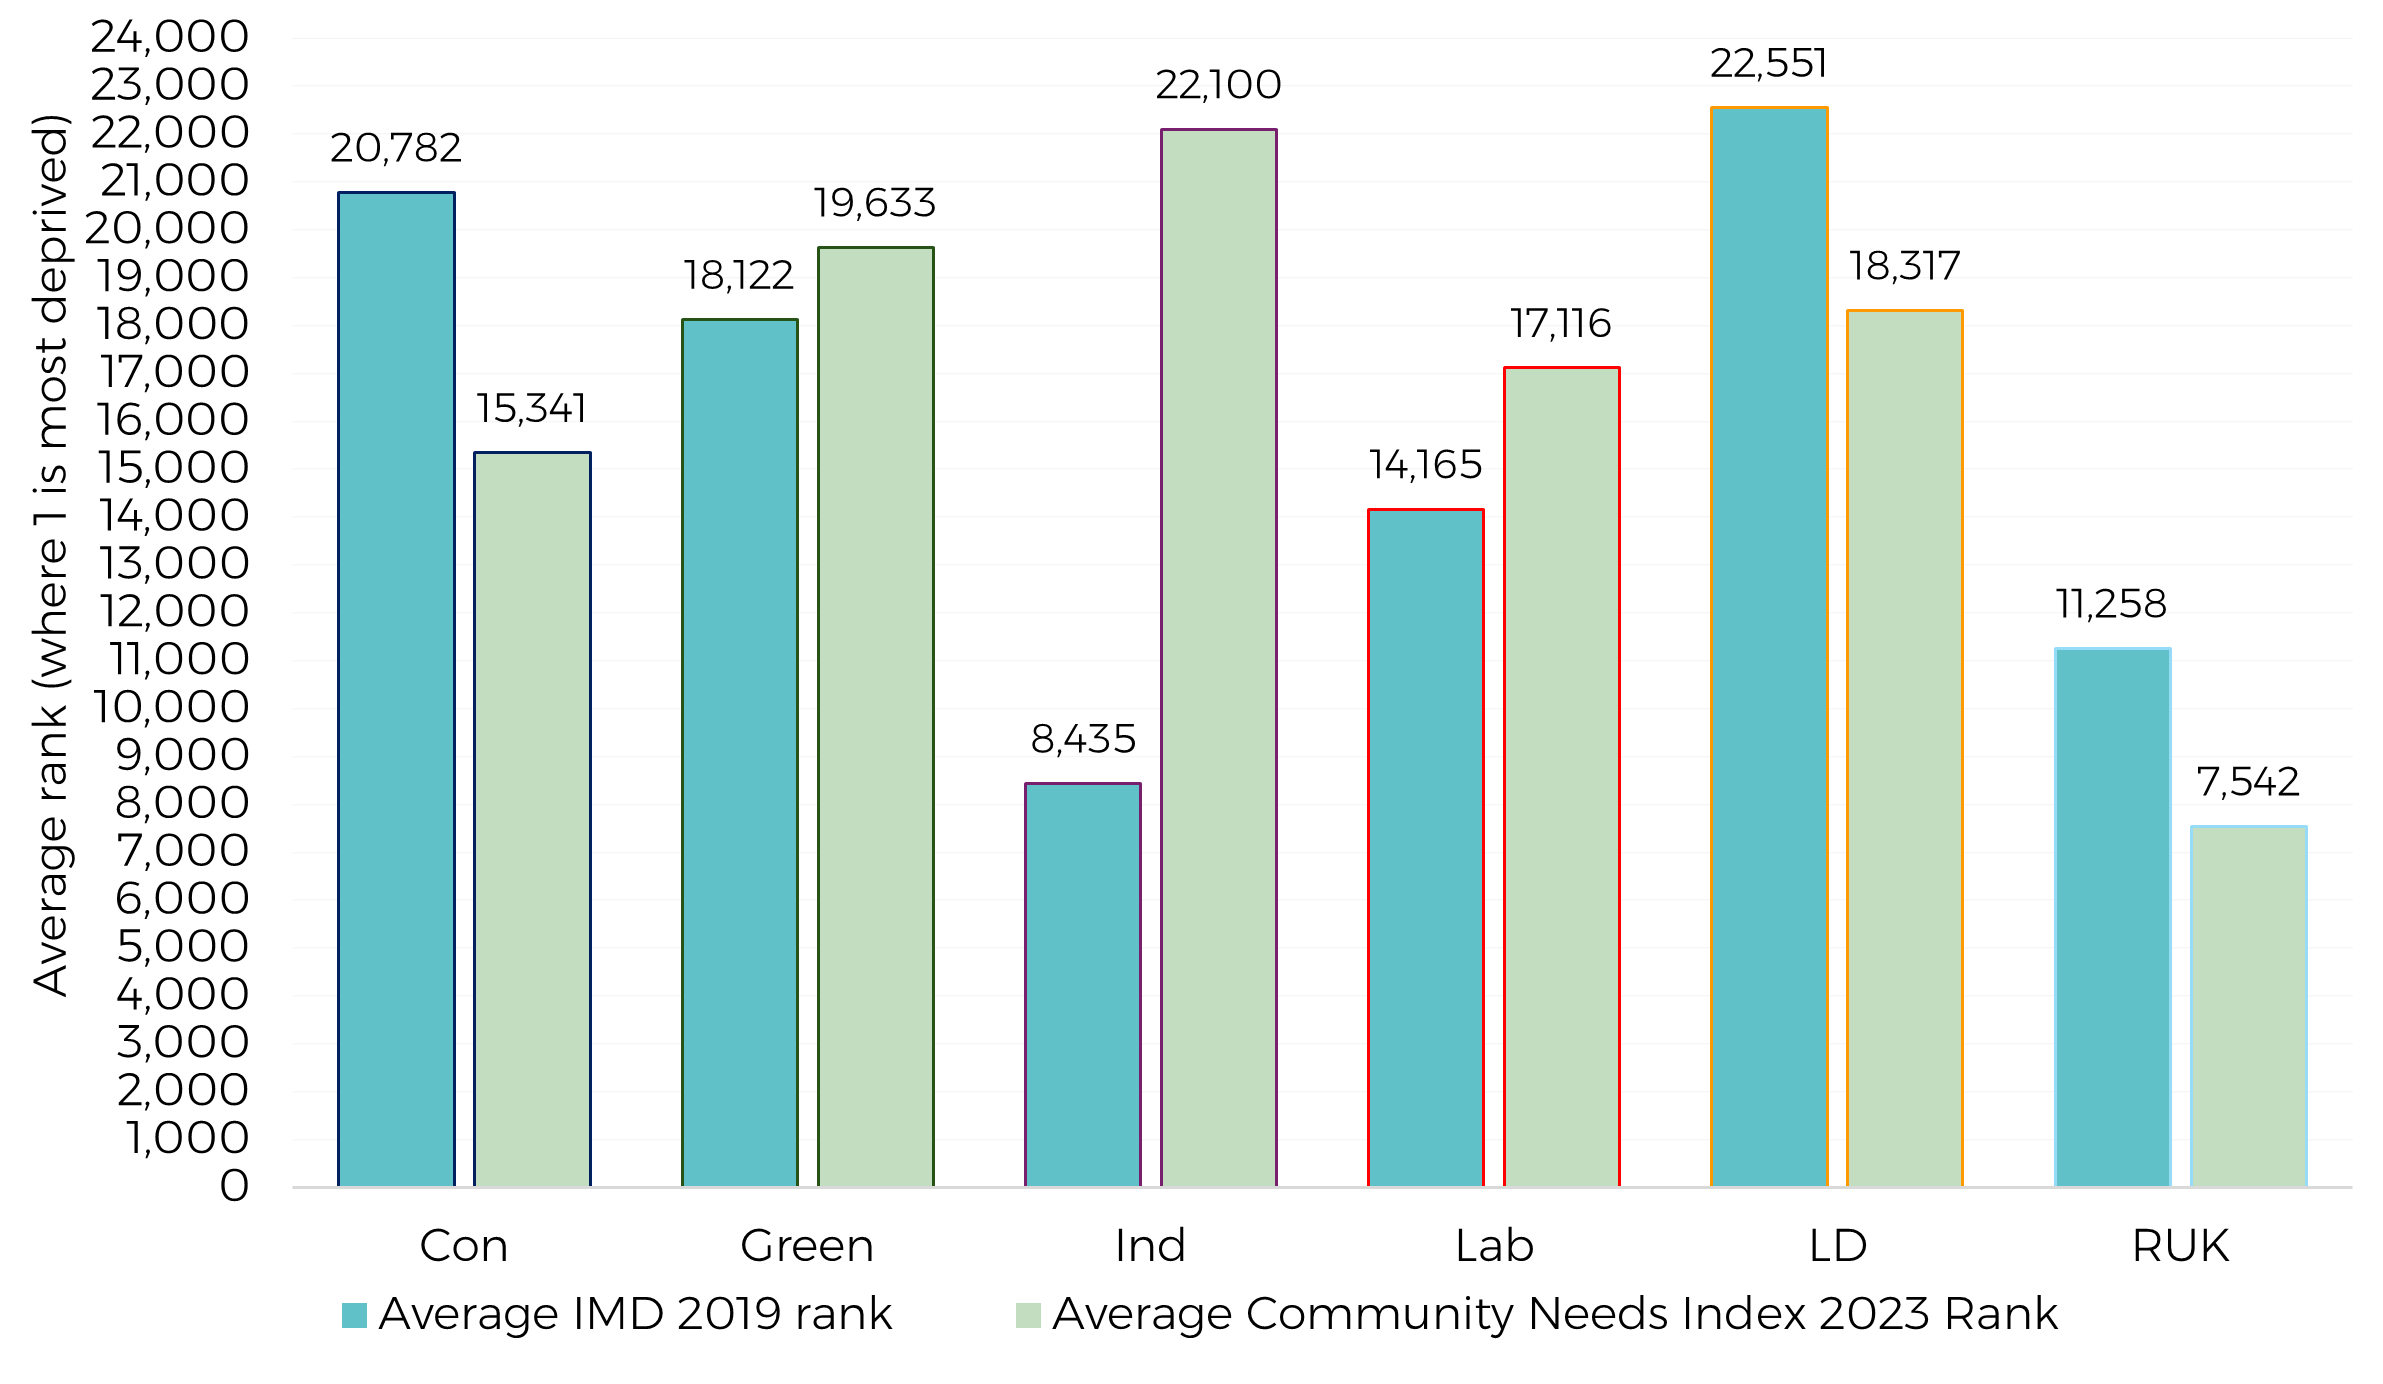
The five seats held by Independent candidates showed higher levels of deprivation than those held by mainstream political parties. All of these seats are located in inner city areas with multiple socio-economic challenges.
The seats held by Reform UK also showed notably higher levels of deprivation than the national average. This reflects their location in peripheral coastal areas with economic challenges.
Labour-held seats were also more deprived than the national average. By contrast, the Liberal Democrat seats were the least deprived on average.
The table below shows the 20 English Parliamentary Constituencies with the highest levels of deprivation on the Index of Multiple Deprivation 2019.
| Constituency | Result | First party | Second party |
|---|---|---|---|
| Birmingham Ladywood | Lab hold | Lab | Ind |
| Blackpool South | Lab gain from Con | Lab | RUK |
| Liverpool Walton | Lab hold | Lab | RUK |
| Liverpool Riverside | Lab hold | Lab | Green |
| Birmingham Erdington | Lab hold | Lab | RUK |
| Birmingham Hodge Hill & Solihull Nth | Lab hold | Lab | WPB |
| Knowsley | Lab hold | Lab | RUK |
| Bradford West | Lab hold | Lab | Ind |
| Birmingham Perry Barr | Ind gain from Lab | Ind | Lab |
| Wolverhampton South East | Lab hold | Lab | RUK |
| Leeds South | Lab hold | Lab | Green |
| Liverpool West Derby | Lab hold | Lab | RUK |
| Birmingham Yardley | Lab hold | Lab | WPB |
| Bradford East | Lab hold | Lab | Ind |
| Sheffield Brightside and Hillsborough | Lab hold | Lab | Green |
| Bolton South and Walkden | Lab hold | Lab | RUK |
| Walsall and Bloxwich | Lab gain from Con | Lab | Ind |
| Manchester Rusholme | Lab hold | Lab | Green |
| Tipton and Wednesbury | Lab gain from Con | Lab | Con |
| Blackley and Middleton South | Lab hold | Lab | RUK |
Labour won 19 of the 20 most deprived constituencies.. Of these, 16 were previously held in 2019 and three were gained from the Conservatives. An Independent candidate won the remaining constituency, Birmingham Perry Barr.
It is notable that the Conservative party came second in only one of the 20 most deprived constituencies, with smaller parties and independents being the major opposition to the Labour vote. Reform UK came second in eight of the 20 constituencies, the Green’s came second in four constituencies, the Workers Party in two constituencies and Independent candidates in the remaining four constituencies.
The Reform UK seats showed considerably higher levels of community needs than the seats held by other parties, indicating greater social infrastructure challenges in these areas. The Conservative-held seats also performed less well on the Community Needs Index than the national average. By contrast, the seats held by left-leaning parties (Greens and Independents) tended to have the lowest levels of community need.
The table below shows the 20 English Parliamentary Constituencies with the highest levels of need on the Community Needs Index.
| Constituency | Result | First party | Second party |
|---|---|---|---|
| Clacton | RUK gain from Con | RUK | Con |
| Great Yarmouth | RUK gain from Con | RUK | Con |
| Isle of Wight East | Con hold | Con | Lab |
| North Norfolk | LD gain from Con | LD | Con |
| North West Norfolk | Con hold | Con | Lab |
| South West Norfolk | Lab gain from Con | Lab | RUK |
| North East Cambridgeshire | Con hold | Con | Lab |
| Broadland and Fakenham | Con hold | Con | Lab |
| Mid Norfolk | Con hold | Con | Lab |
| Lowestoft | Lab gain from Con | Lab | RUK |
| Bridgwater | Con hold | Con | Lab |
| Isle of Wight West | Lab gain from Con | Lab | RUK |
| Kingston upon Hull East | Lab hold | Lab | RUK |
| South Norfolk | Lab gain from Con | Lab | RUK |
| Easington | Lab hold | Lab | RUK |
| Torridge and Tavistock | Con hold | Con | Lab |
| Louth and Horncastle | Con hold | Con | Lab |
| South Holland and The Deepings | Con hold | Con | Lab |
| Normanton and Hemsworth | Lab hold | Lab | RUK |
| Boston and Skegness | RUK gain from Con | RUK | Con |
Three of the five seats won by Reform UK featured in the top 20 constituencies with the highest community needs – including the two constituencies with the highest needs: Clacton and Great Yarmouth. Reform UK also came second in seven of the top 20 seats. The Conservatives held 9 of the 20 constituencies with highest community needs. Labour won seven of these constituencies, while the Liberal Democrats held one.
The chart below shows the average IMD and CNI ranks for areas that Labour and the Liberal Democrats held vs those that they won from the Conservatives.
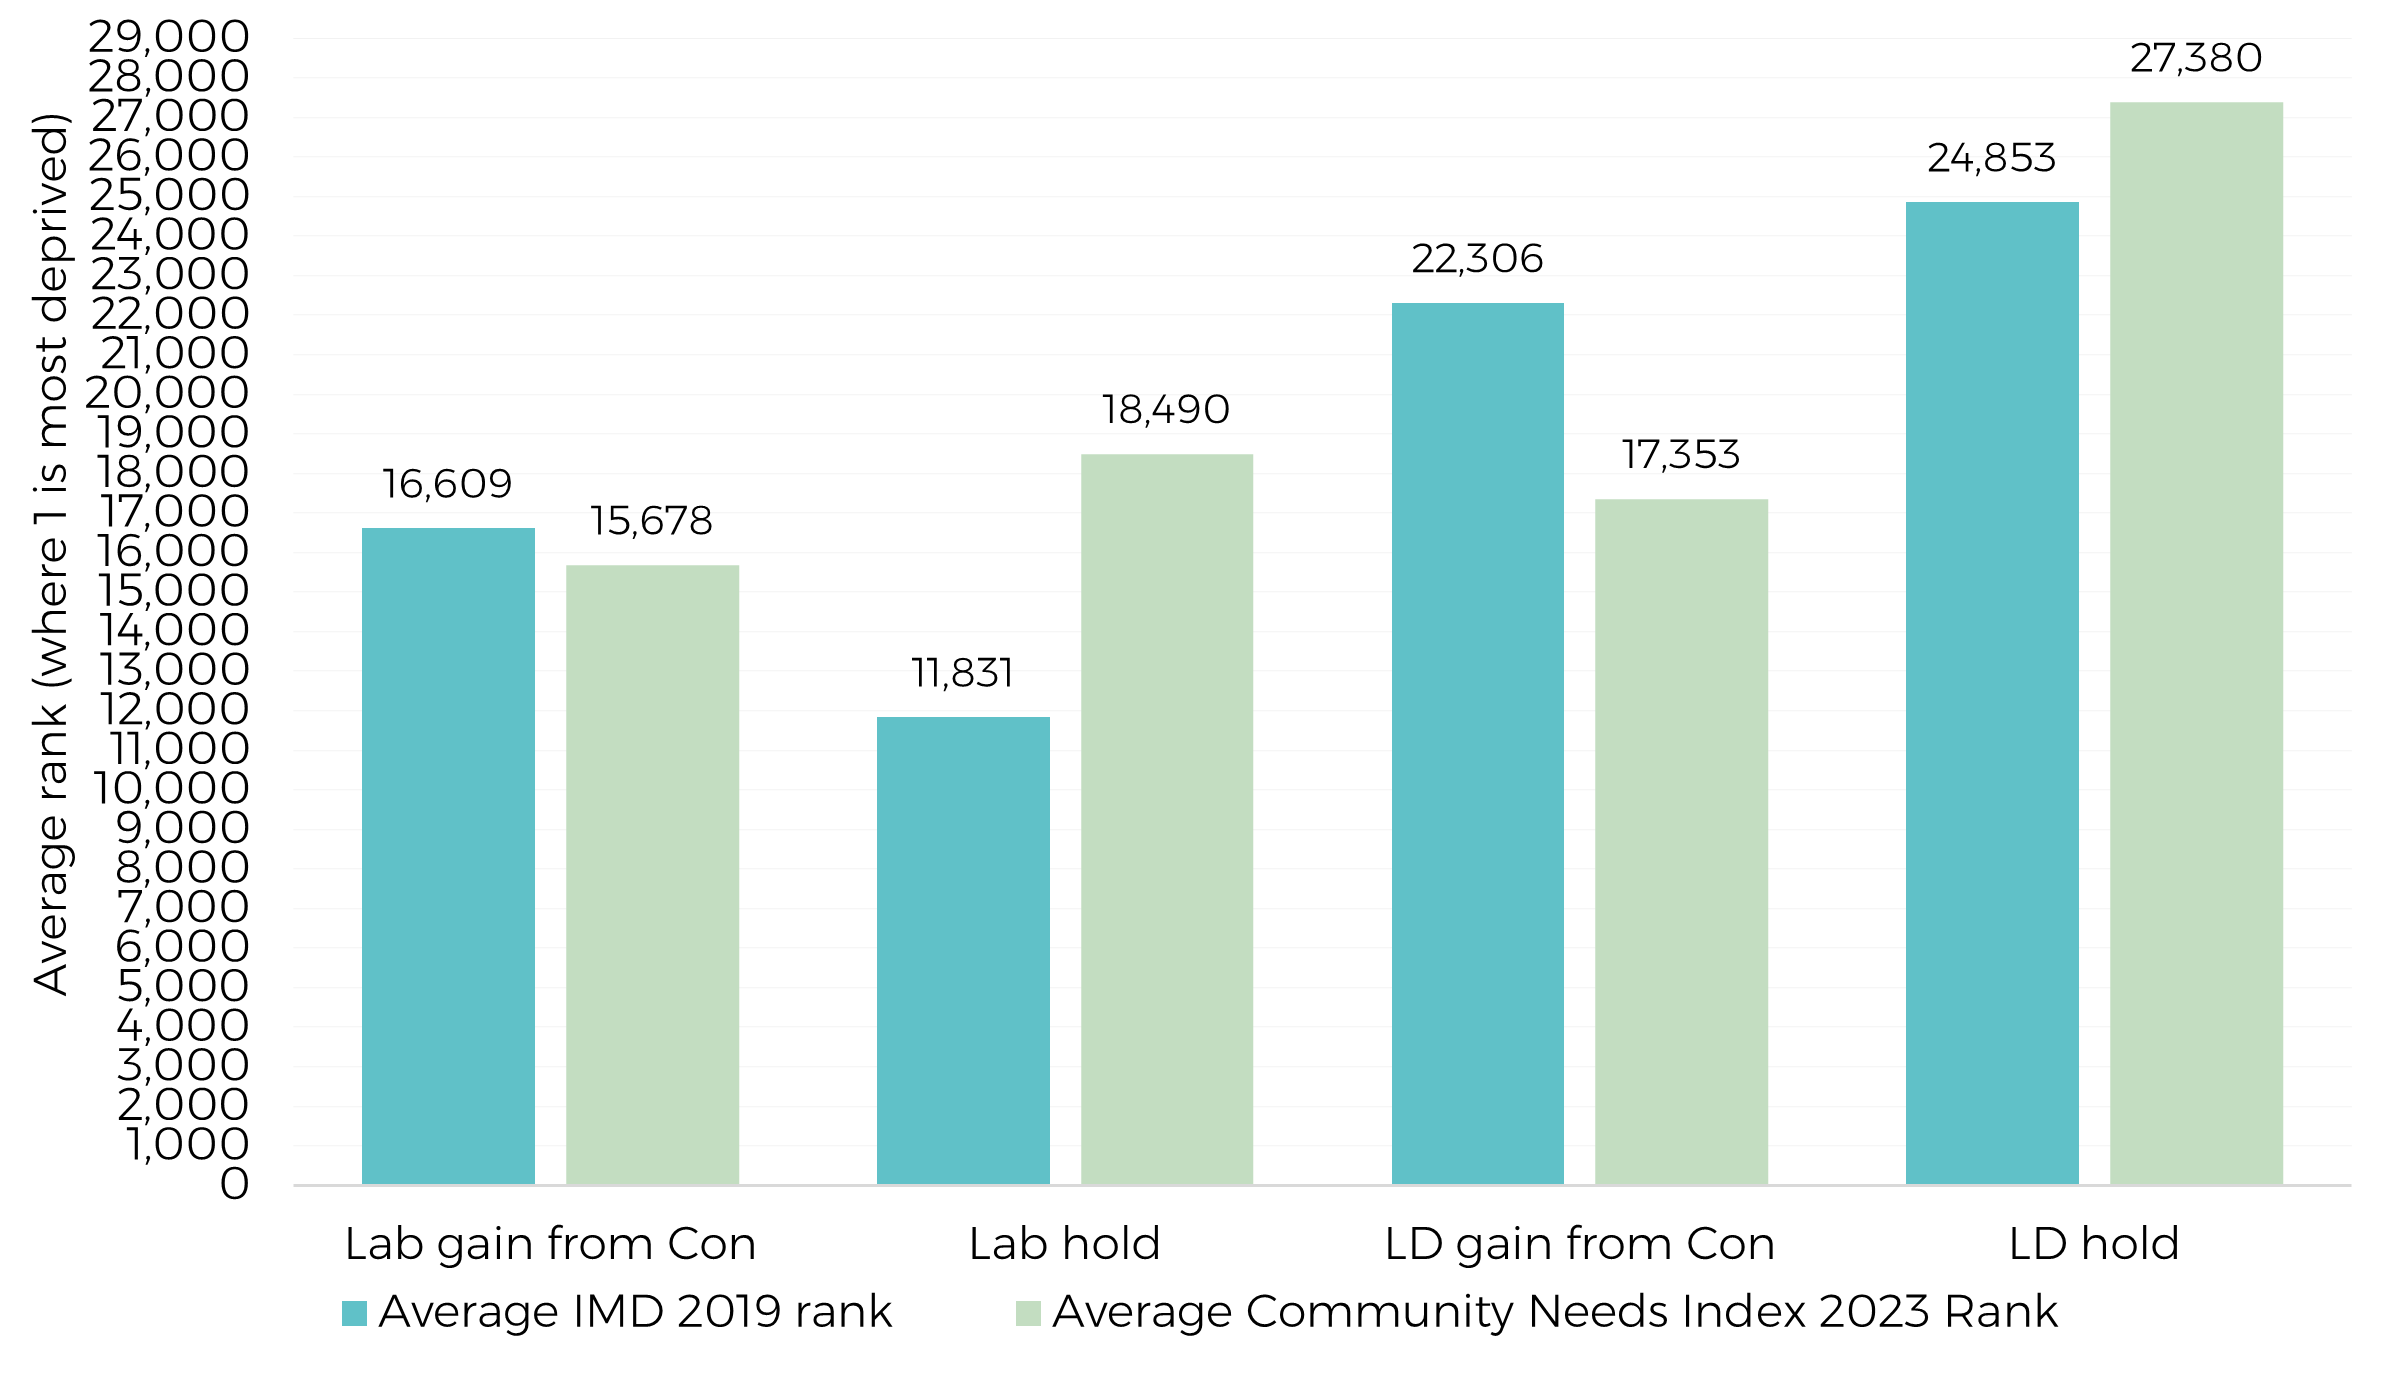
The seats that Labour gained from the Conservatives had deprivation levels that were broadly in line with the national average, whereas the seats they held were considerably more deprived than the national average. However, the seats they gained tended to have higher levels of Community Need than the seats they previously held on to. This reflects Labour gains outside of their traditional urban heartlands.
The seats that the Liberal Democrats gained from the Conservatives tended to be in areas with higher levels of deprivation and higher levels of community need than the seats that they held. However, both the seats they gained, and the seats they held, had lower deprivation and community needs than the national average.
The overall findings show some clear differences in deprivation levels and community needs in the constituencies won by the different political parties. However, these relationships are not straightforward. As we will see below, there is not a clear relationship between community needs and deprivation with regards to election results. The parties that had electoral success in areas with high community need were not necessarily areas that are also economically deprived.
Reform UK held constituencies performed relatively poorly on both Indices. By contrast, Independent candidates were successful in seats which were relatively deprived but which had low levels of identified community need – reflecting their locations in inner areas with better connectivity, stronger presence of civic assets and a more active and present third sector. The seats won by the Conservatives also on average performed worse in terms of community needs than deprivation, while the opposite was true in Labour areas. Liberal Democrat and Green constituencies tended to perform better on both indices.
To find out more about the Community Need Index and for all the latest news and analysis please sign up to our Community Needs Index mailing list
Find out more about the data from this analysis below:
Local Insight is our place-based data, mapping and reporting platform. Our latest updates to the platform introduced Parliamentary Constituencies for England, Scotland and Wales as Standard Areas – allowing users to explore data for these newly-defined boundaries and the challenges they may face through more than 1500 indicators.
To learn more about Local Insight, head to the website or book a demo today.

Many funding programmes use the Index of Multiple Deprivation (IMD) to identify…
More
The results of the May 2026 local elections provided plenty to reflect…
More
Local data and evidence on community needs, demographics and outcomes to support…
More