
Extreme heat is becoming an increasingly important challenge for communities across England, with 2026 being the first year that temperatures have reached 35C or more in four consecutive months.
The same period of hot weather can have very different consequences depending on who lives in an area, the homes they live in, the surrounding environment and the resources people have available to prepare for and respond to heat.
To explore these differences, we have developed a new Extreme Heat Vulnerability Index, identifying the neighbourhoods across England where the conditions associated with vulnerability to extreme heat are most concentrated.
The Index is available for all 33,755 Lower-layer Super Output Areas (LSOAs) in England, allowing patterns to be explored at neighbourhood level.
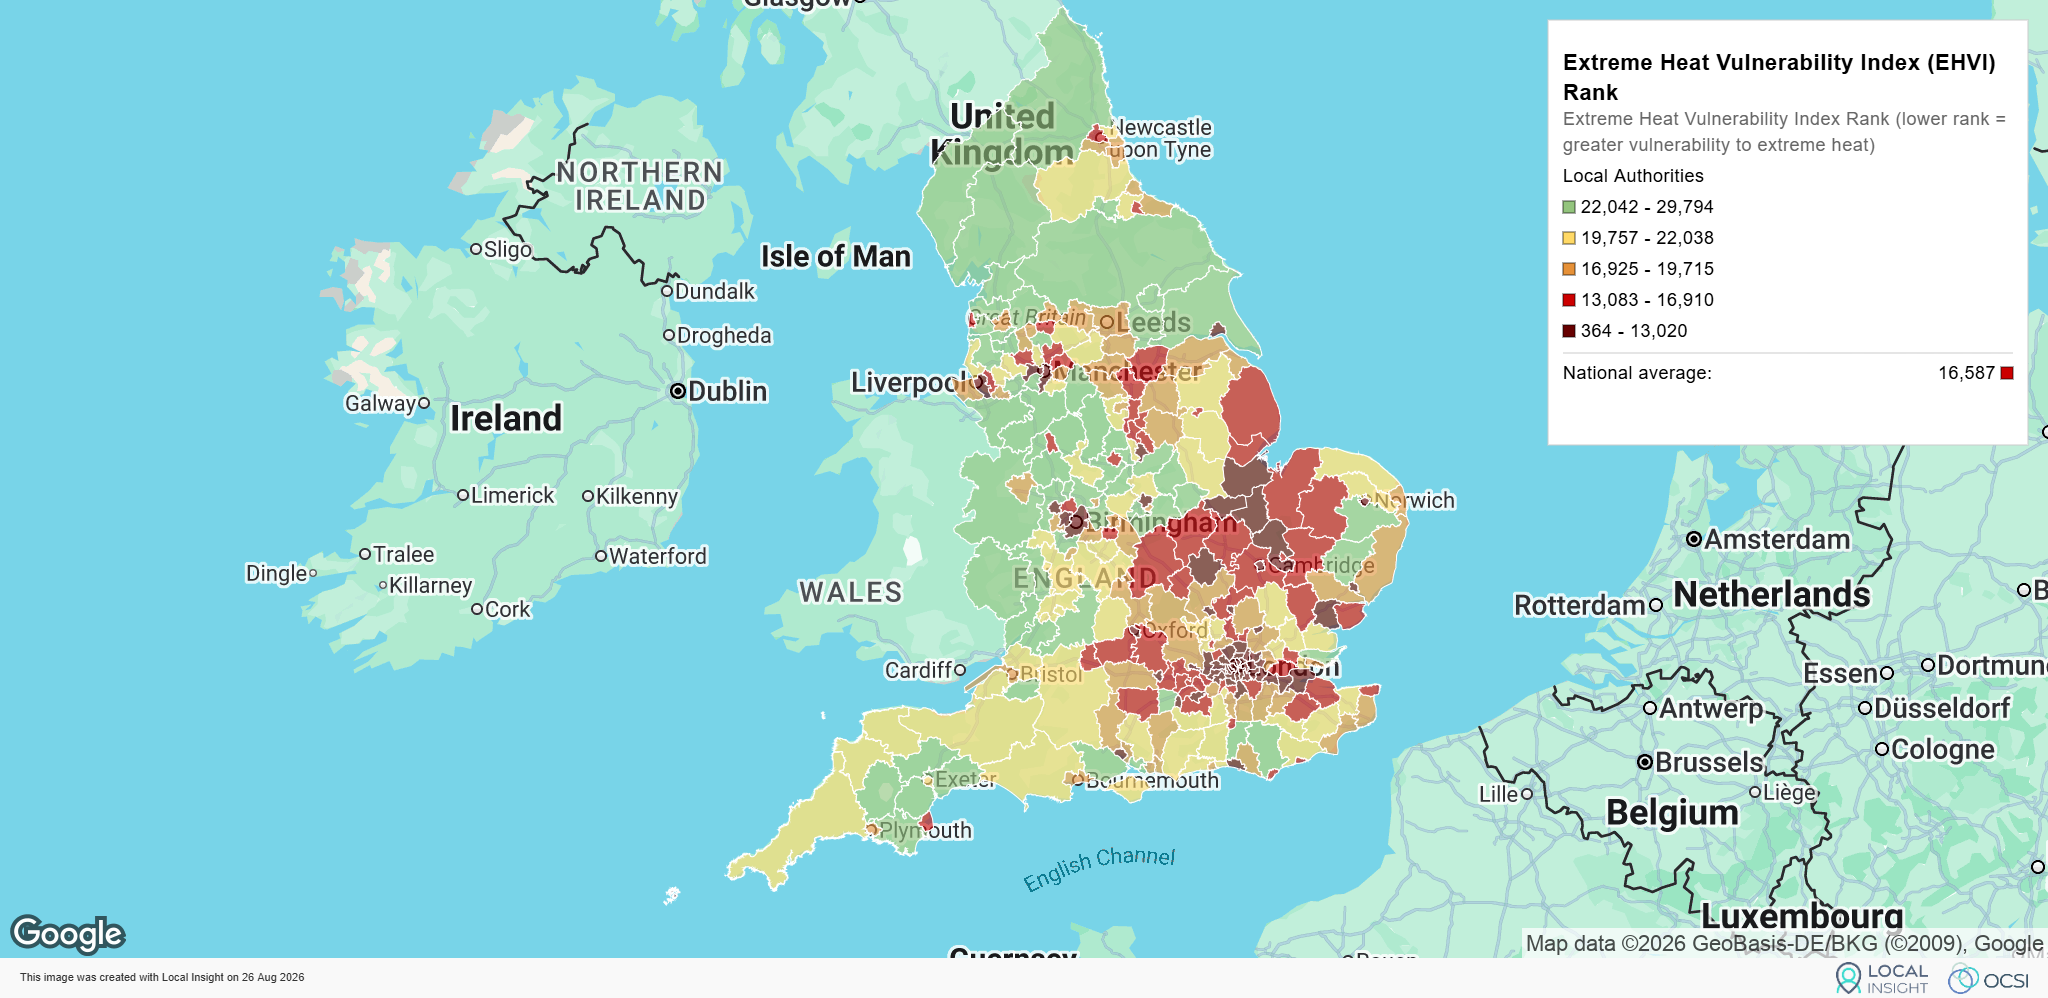
Our accompanying analysis shows that overall vulnerability is particularly concentrated in Inner London, but the factors driving heat vulnerability vary considerably across the country.
Read our analysis of the findings.
Climate change is increasing the frequency and intensity of extreme heat events with evidence showing that periods of hot weather feel particularly uncomfortable in the UK.
Beyond this, the health consequences are already significant. Researchers from Imperial College London, the Met Office and the London School of Hygiene & Tropical Medicine estimated that more than 2,700 people died from heat-related causes during the May and June 2026 heatwaves in England and Wales, with around 42% of those deaths attributable to the additional heat associated with human-induced climate change.
However, heat does not affect everyone equally. Older residents and people living with long-term health conditions can face greater physical risks. Households on low incomes may find it harder to pay for cooling measures or make changes to their homes. Renters may have less control over adaptations such as external shading or air conditioning.
Where people live matters too. Trees, green spaces and water can provide shade and cooler environments. Conversely, dense development, poor air quality, overcrowded housing and a lack of private outdoor space can increase vulnerability.
The Extreme Heat Vulnerability Index brings together these distinct factors into one composite measure to help explore where resilience to extreme heat events may come under most pressure.
Our conceptual framework was informed by Friends of the Earth’s research into neighbourhood vulnerability to heatwaves and wider evidence on the factors that affect people’s susceptibility, exposure and capacity to adapt.
We brought these factors together into five domains.
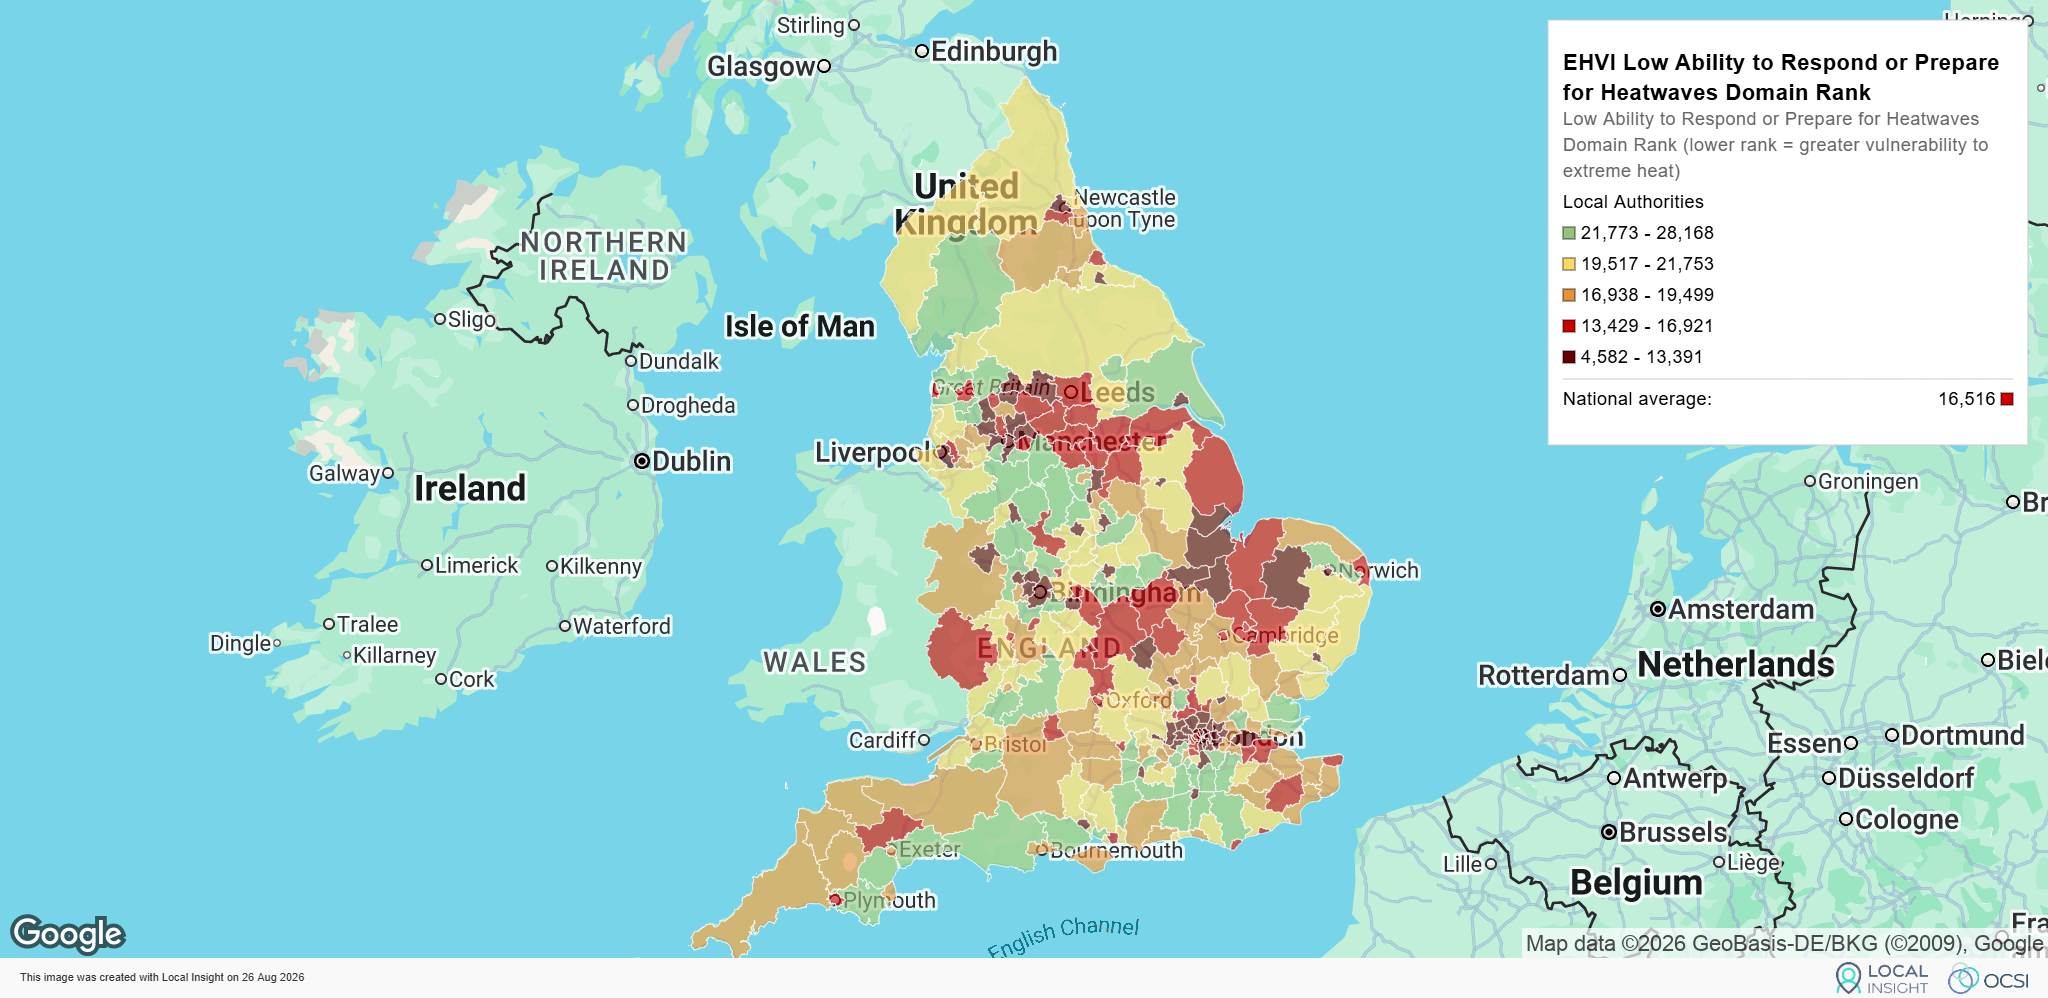
Some households have fewer resources or less freedom to adapt when temperatures rise. Together these measures provide an indication of some of the practical and socioeconomic barriers that can make responding to a heatwave more difficult.
This domain captures:
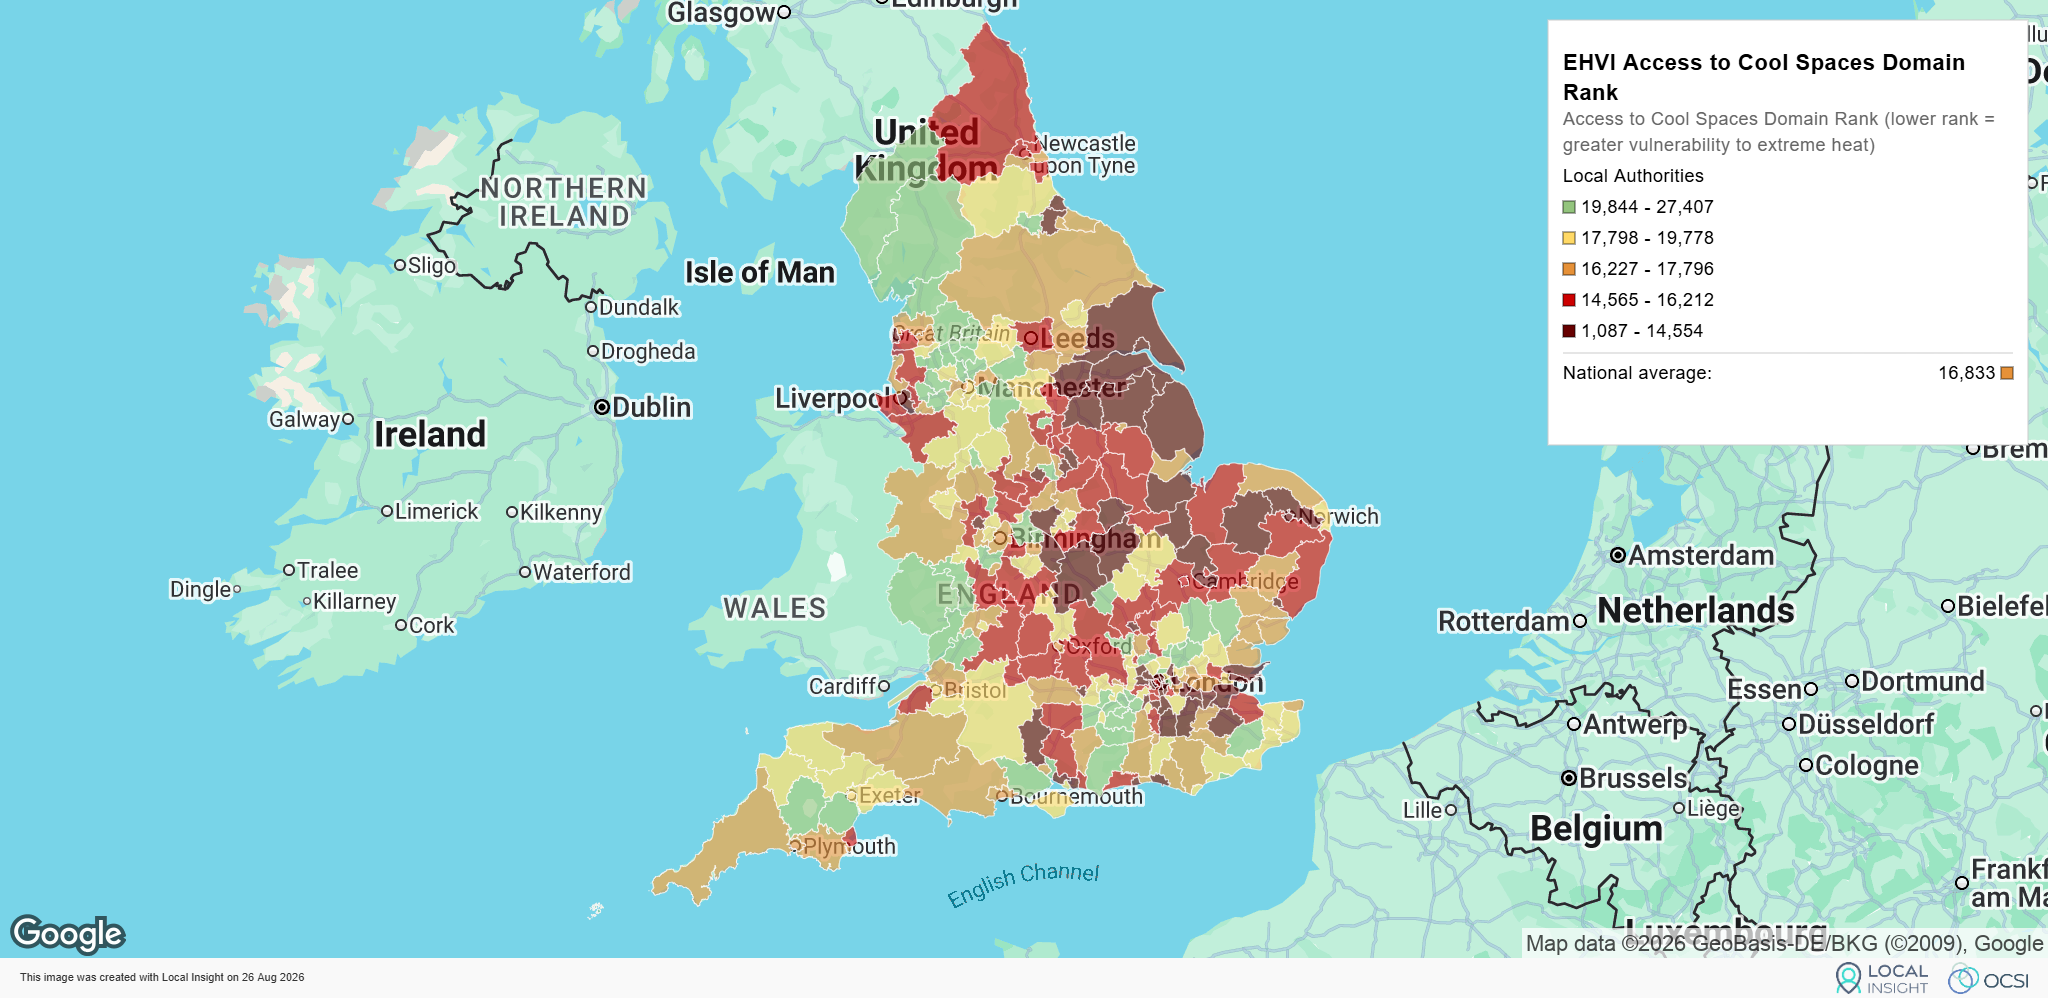
Access to places that can offer some relief from heat can be important during periods of extreme temperatures. It therefore focuses specifically on whether residents have green or blue spaces nearby that may provide opportunities for cooling and respite.
This domain brings together:
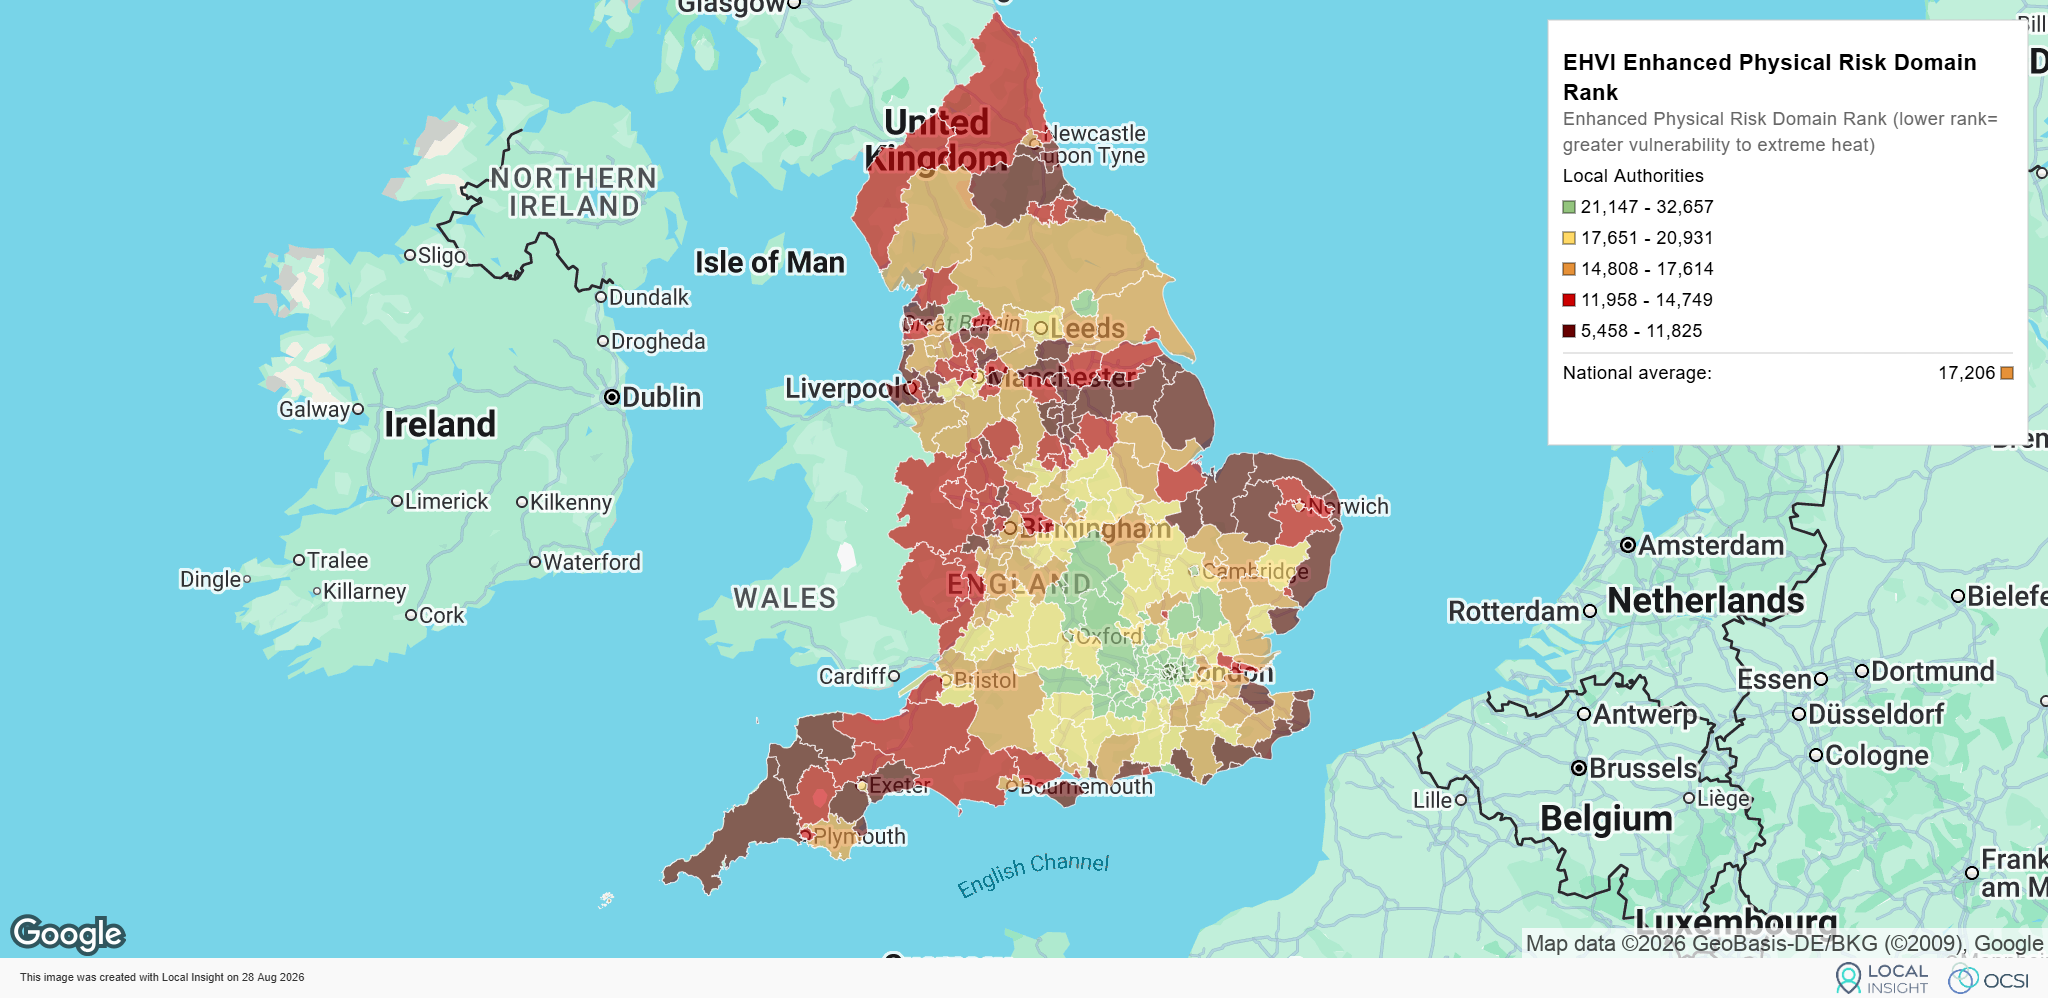
Some groups can face a greater risk of illness or mortality when exposed to high temperatures.
This domain measures the proportion of residents who are:
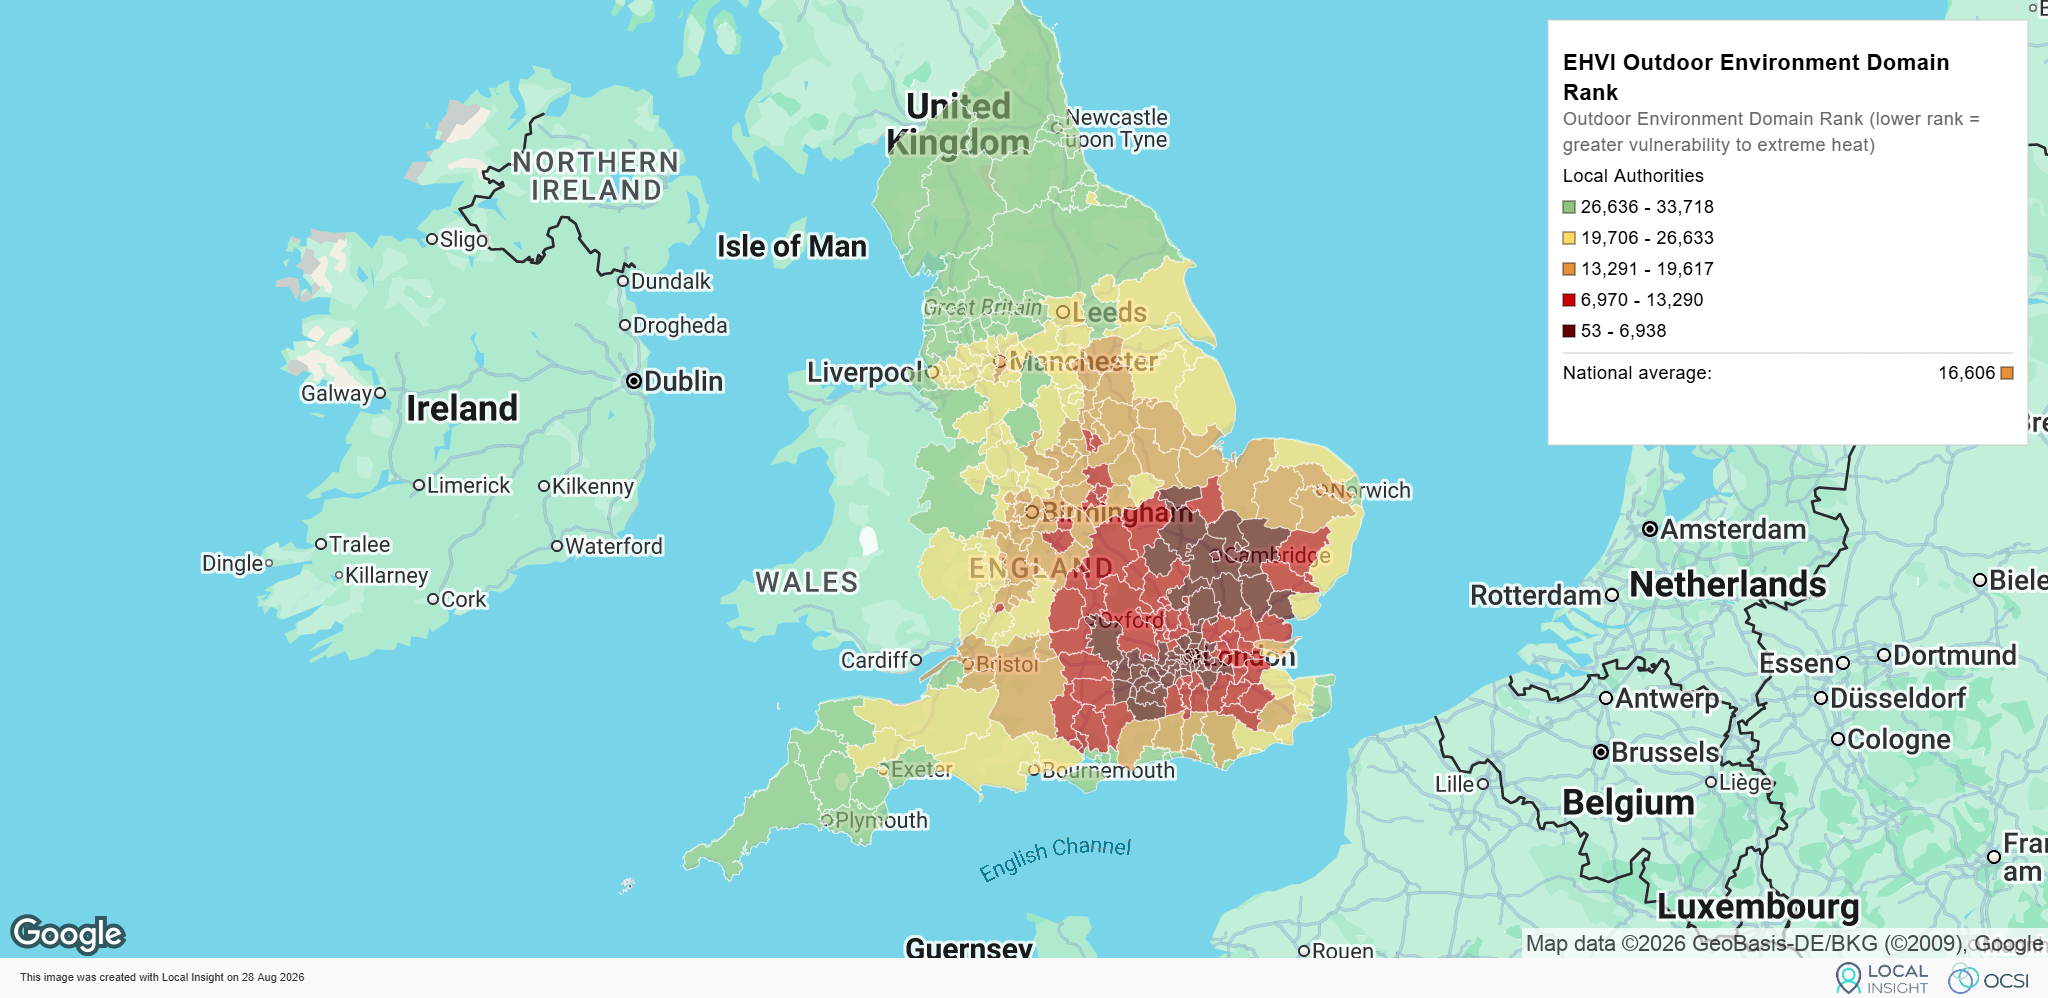
The physical characteristics of neighbourhoods can either protect communities from extreme heat or make its effects worse.
This domain combines:
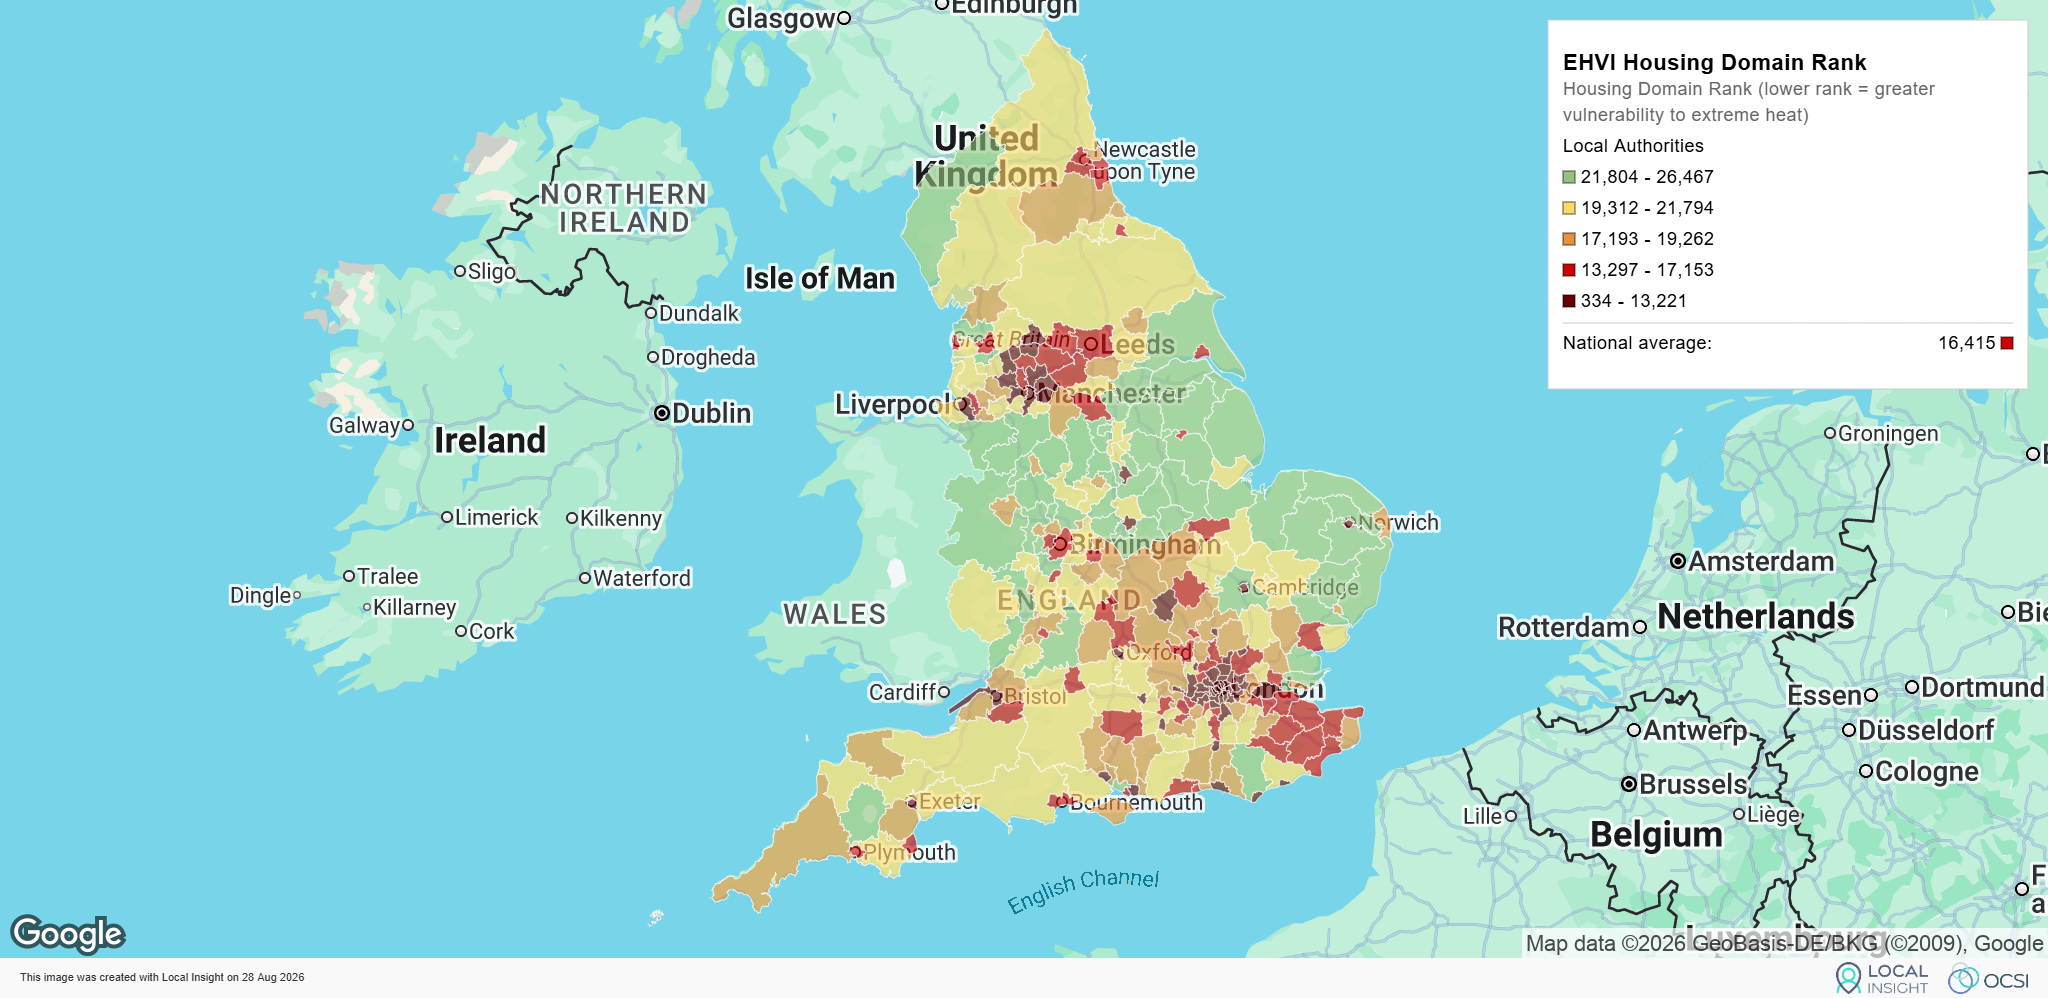
People spend a substantial proportion of their time at home, so housing conditions can play an important role in shaping exposure to high temperatures. These measures provide an indication of housing conditions that may make it more difficult for residents to remain comfortable and manage indoor temperatures.
The Housing domain includes:
Local Authority averages are useful for understanding broad patterns, but they can conceal individual communities where several different vulnerabilities overlap.
We therefore constructed the Index at Lower-layer Super Output Area level. LSOAs typically contain around 1,500–3,000 residents and provide a consistent geography for comparing neighbourhoods across England. A wide range of datasets are also directly available at this level.
The result is a relative measure showing how every neighbourhood in England compares with every other neighbourhood.
It is important to stress that the Index does not predict where individual heat-related deaths or illnesses will occur. Nor does a highly vulnerable neighbourhood imply that every person living there is vulnerable.
Instead, it identifies places where the underlying conditions associated with vulnerability are particularly concentrated.
The Extreme Heat Vulnerability Index provides a consistent neighbourhood-level picture across England, but there are opportunities to strengthen it as new data becomes available. One important gap is information on how households currently keep cool. There is no nationally consistent small-area dataset showing, for example, the presence of air conditioning, external shading or other active cooling measures in people’s homes. We also lack comparable England-wide data on access to indoors cool spaces such as libraries, community centres and other publicly accessible air-conditioned venues. London has begun to address this through the Mayor of London’s Cool Spaces programme, which maps indoor venues where Londoners can take respite on hot days and identifies whether locations are air conditioned, but there is currently no equivalent national dataset that could be incorporated consistently across England.
There is also scope to strengthen the health dimension of the Index. The current measure uses age, disability and limiting long-term illness as broad indicators of physical susceptibility, but future versions could explore the prevalence of specific conditions known to increase the health impacts of extreme heat, where sufficiently robust neighbourhood-level data become available.
A further opportunity would be to incorporate evidence on observed heat-related mortality. ONS has historically published winter mortality data down to lower geographical areas, providing an example of the kind of local outcome data that can support place-based analysis. UKHSA also monitors heat-associated mortality, but the interim report for the May and June 2026 heat events currently provides national estimates only and explicitly excludes detailed geographic analysis. Developing more consistent local heat-mortality statistics would provide an important opportunity to test, validate and potentially enhance future versions of the Index. More broadly, the Index should be viewed as an evolving evidence base: as better national data emerge on household adaptation, access to cooling, health vulnerability and realised heat impacts, these could be incorporated to provide an increasingly complete picture of which communities are most vulnerable and why.
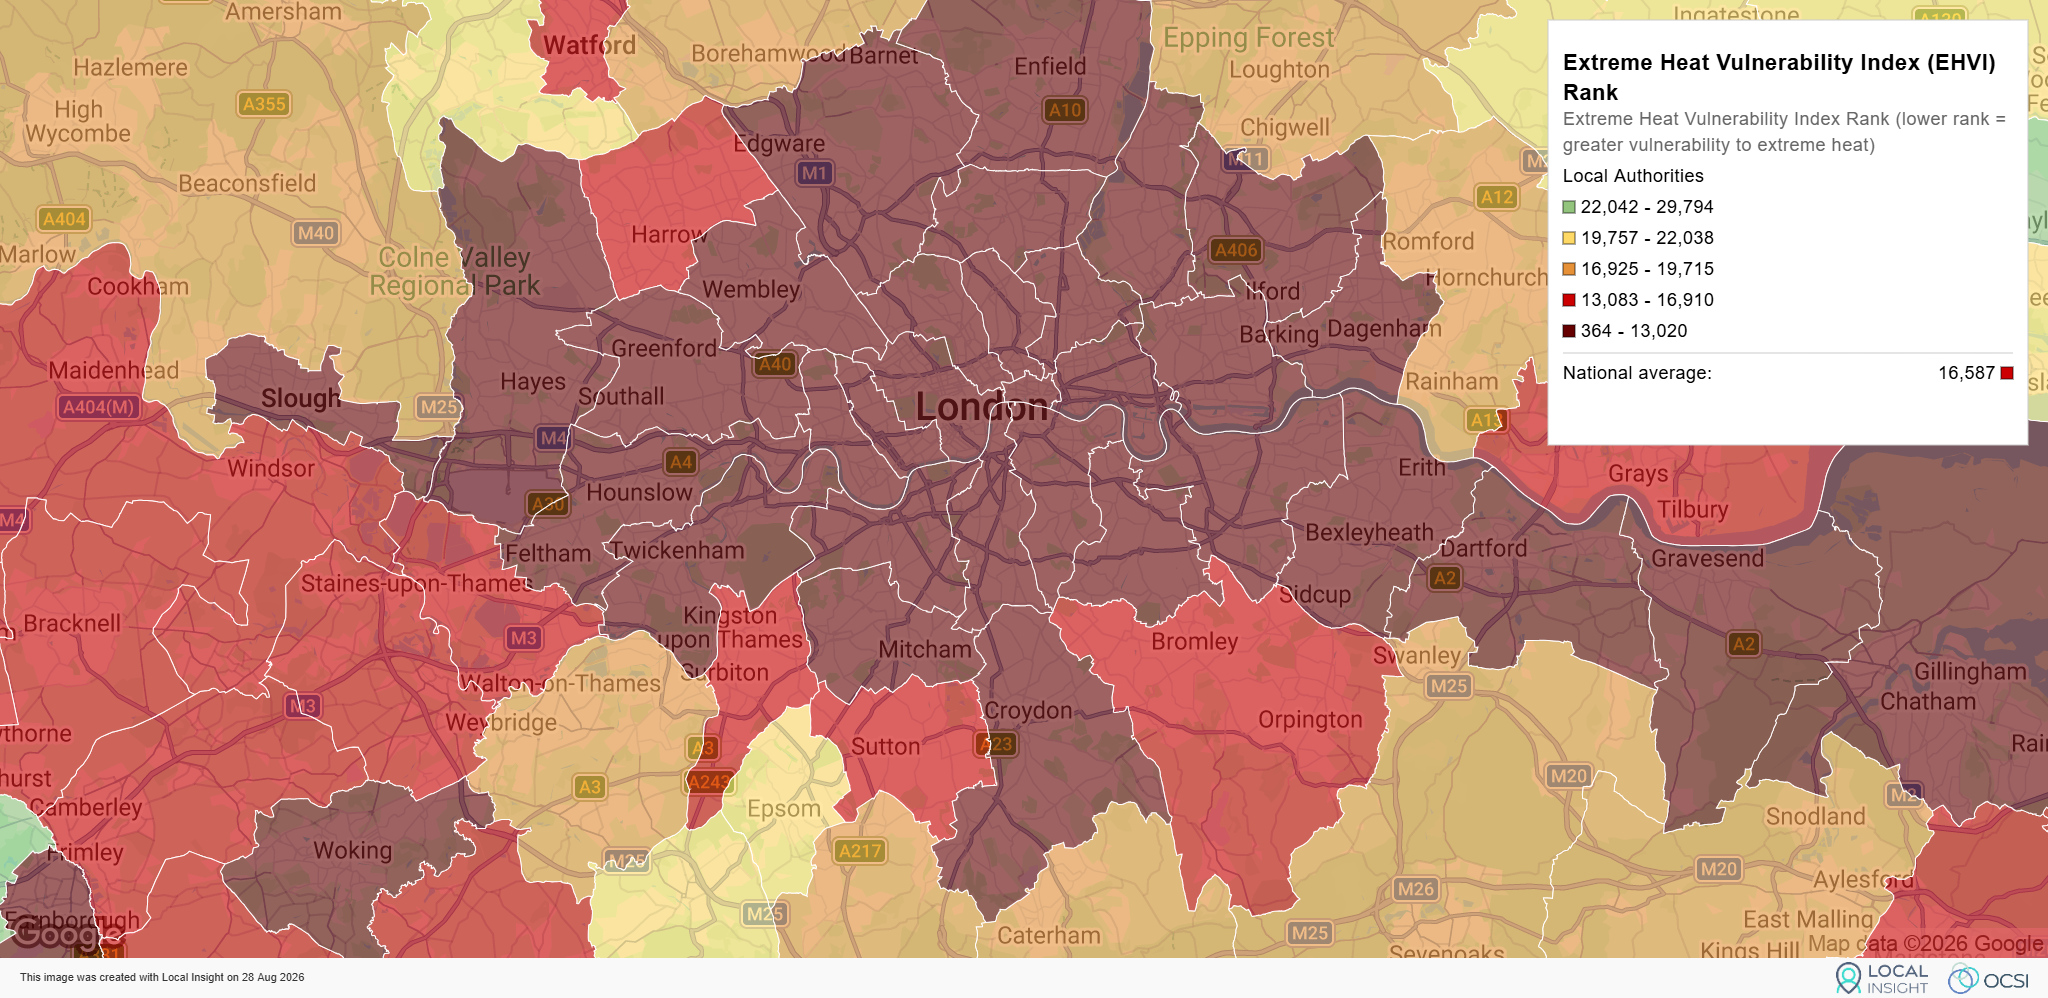
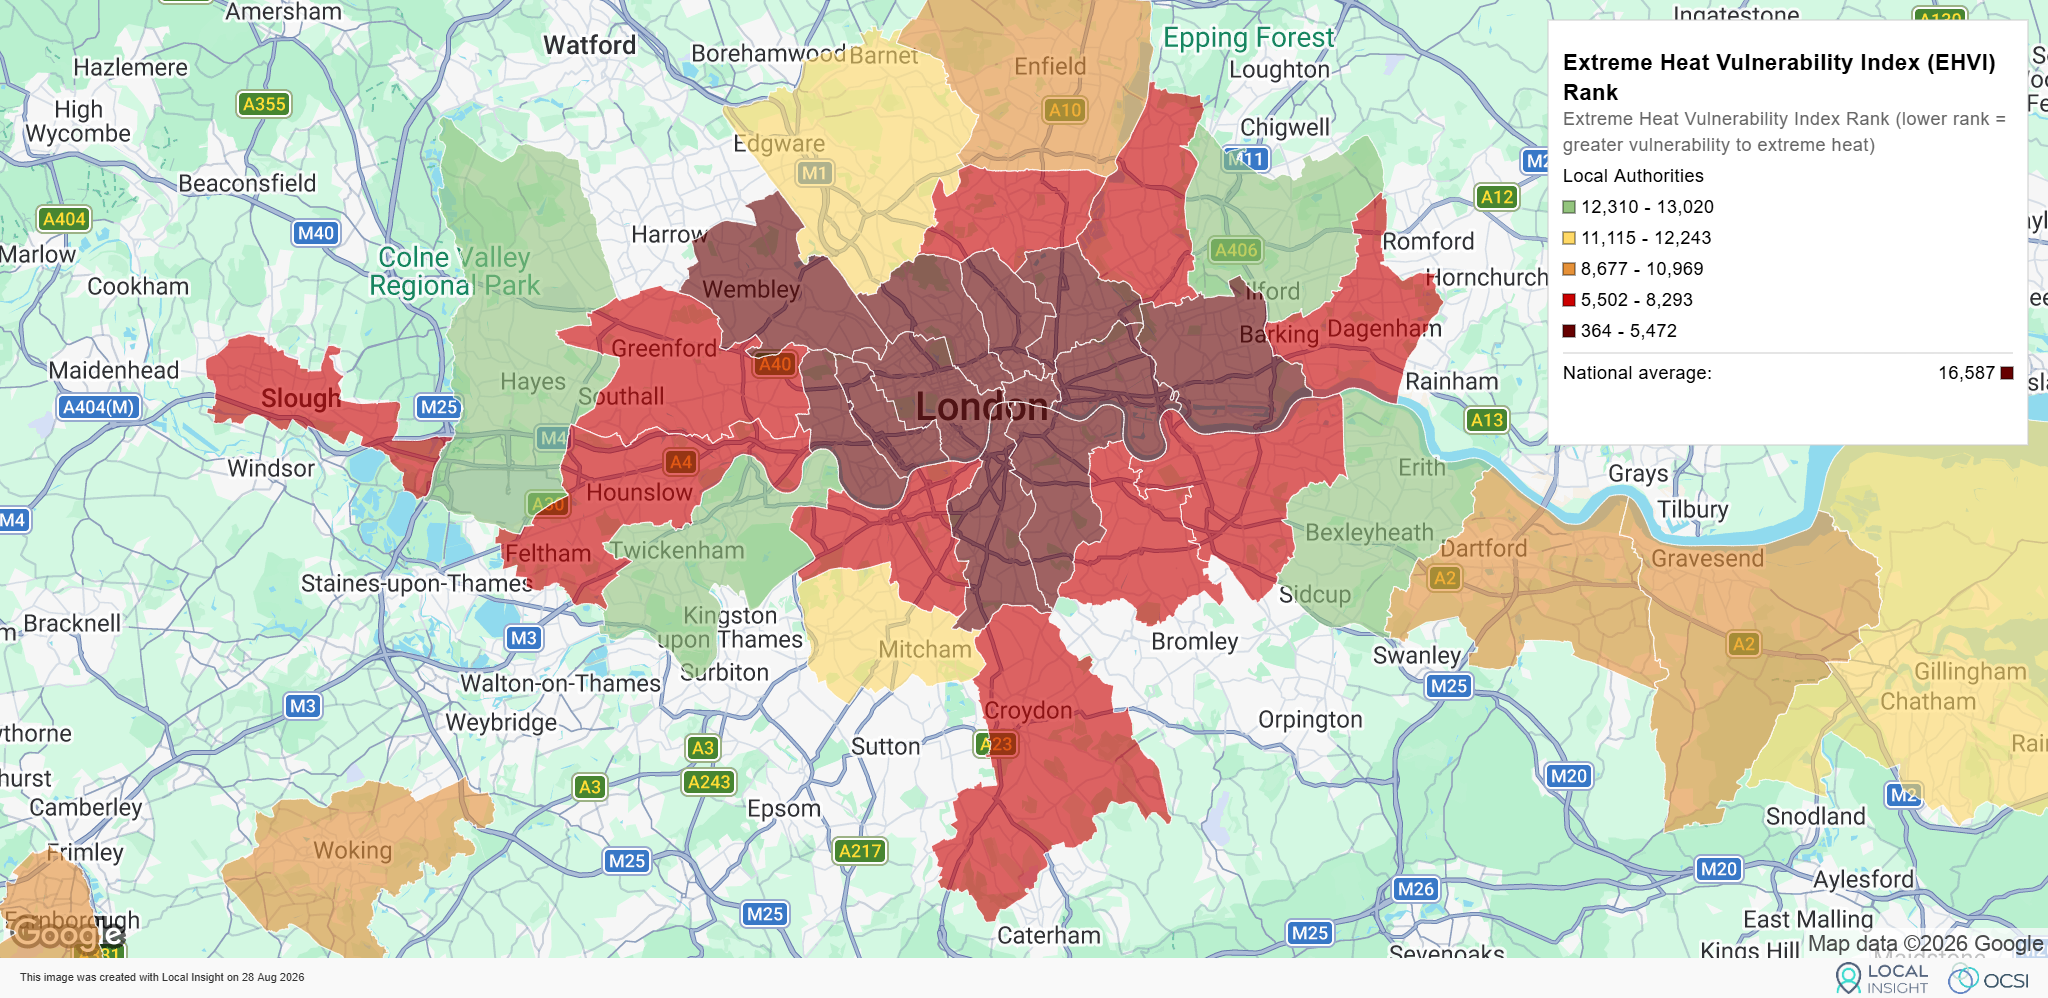
Eighteen of the 20 Local Authorities with the highest average Extreme Heat Vulnerability are in London, with the seven highest-ranking authorities all forming part of the capital’s inner urban core. The first map shows how local authorities in and around London rank on the Extreme Heat Vulnerability Index compared with all local authorities in England. The second isolates those that fall within the 20% most vulnerable nationally.
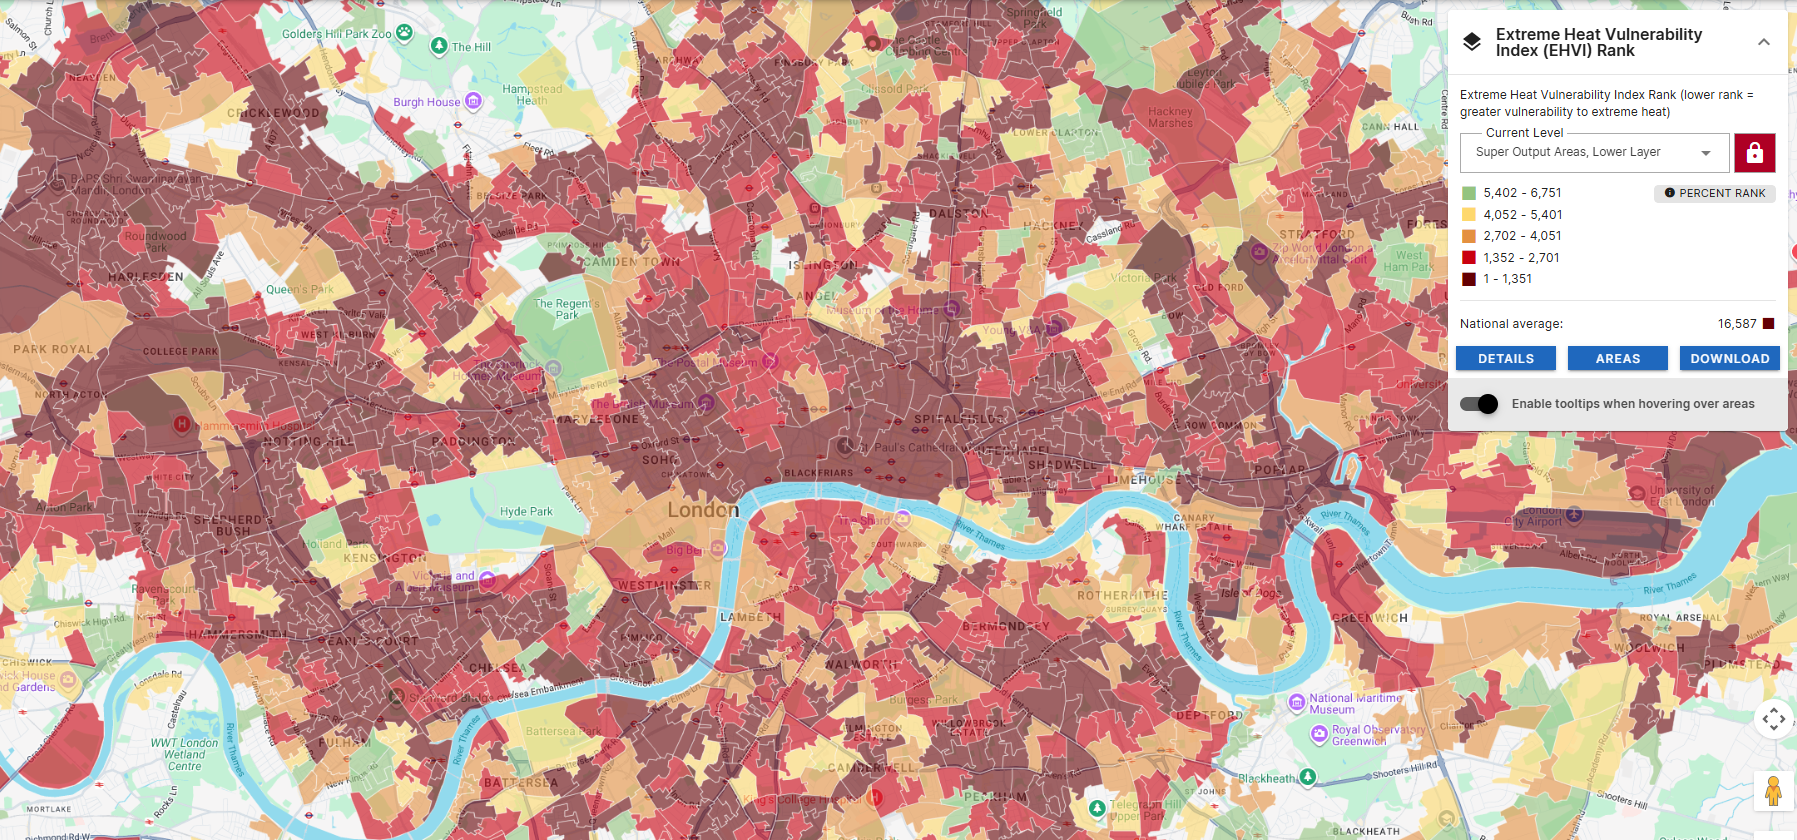
At neighbourhood level, the concentration becomes even stronger: 18 of England’s 20 most vulnerable LSOAs are in Inner London.
The domains also reveal very different forms of vulnerability in different parts of England. Dense inner-city communities tend to face greater challenges linked to housing, the outdoor environment, access to cooling and the ability to adapt. Meanwhile, many coastal communities have substantially greater physical vulnerability, reflecting older populations and higher levels of long-term illness and disability.
Read our full analysis: Where is England most vulnerable to extreme heat?
The Index provides a new source of insight for organisations thinking about climate adaptation, public health, housing, neighbourhood investment and emergency planning.
It can help users:
We have published a full methodology and analysis report, setting out how the Index was developed and exploring the results in more detail.
Read the full Extreme Heat Vulnerability Index report
The Extreme Heat Vulnerability Index and each of the domains is freely available to download at LSOA level.
Download the Extreme Heath Vulnerability Index
Local Insight is a place-based intelligence platform, trusted by 95+ organisations and brings together neighbourhood level data for the areas you care about, all in one place.
If you would like to explore the Extreme Heat Vulnerability Index for the places you work with alongside wider context on deprivation, health, housing and population characteristics, book a demo of Local Insight to see how you can.

Recent research from Imperial College London, the Met Office and the London…
More
The English Community Needs Index (CNI) 2023 is now published as open…
More
Social housing providers have deep, experience-based knowledge of the communities they serve….
More