Many funding programmes use the Index of Multiple Deprivation (IMD) to identify areas with the greatest levels of need. Increasingly, funders are also using the Community Needs Index alongside this, including the Department for Media, Culture and Sport (DCMS) and Historic England.
If you’re applying for funding, you may be asked to demonstrate that the building, service, or project you’re supporting is located in an area that is experiencing high need or falls within the top 20% for both measures.
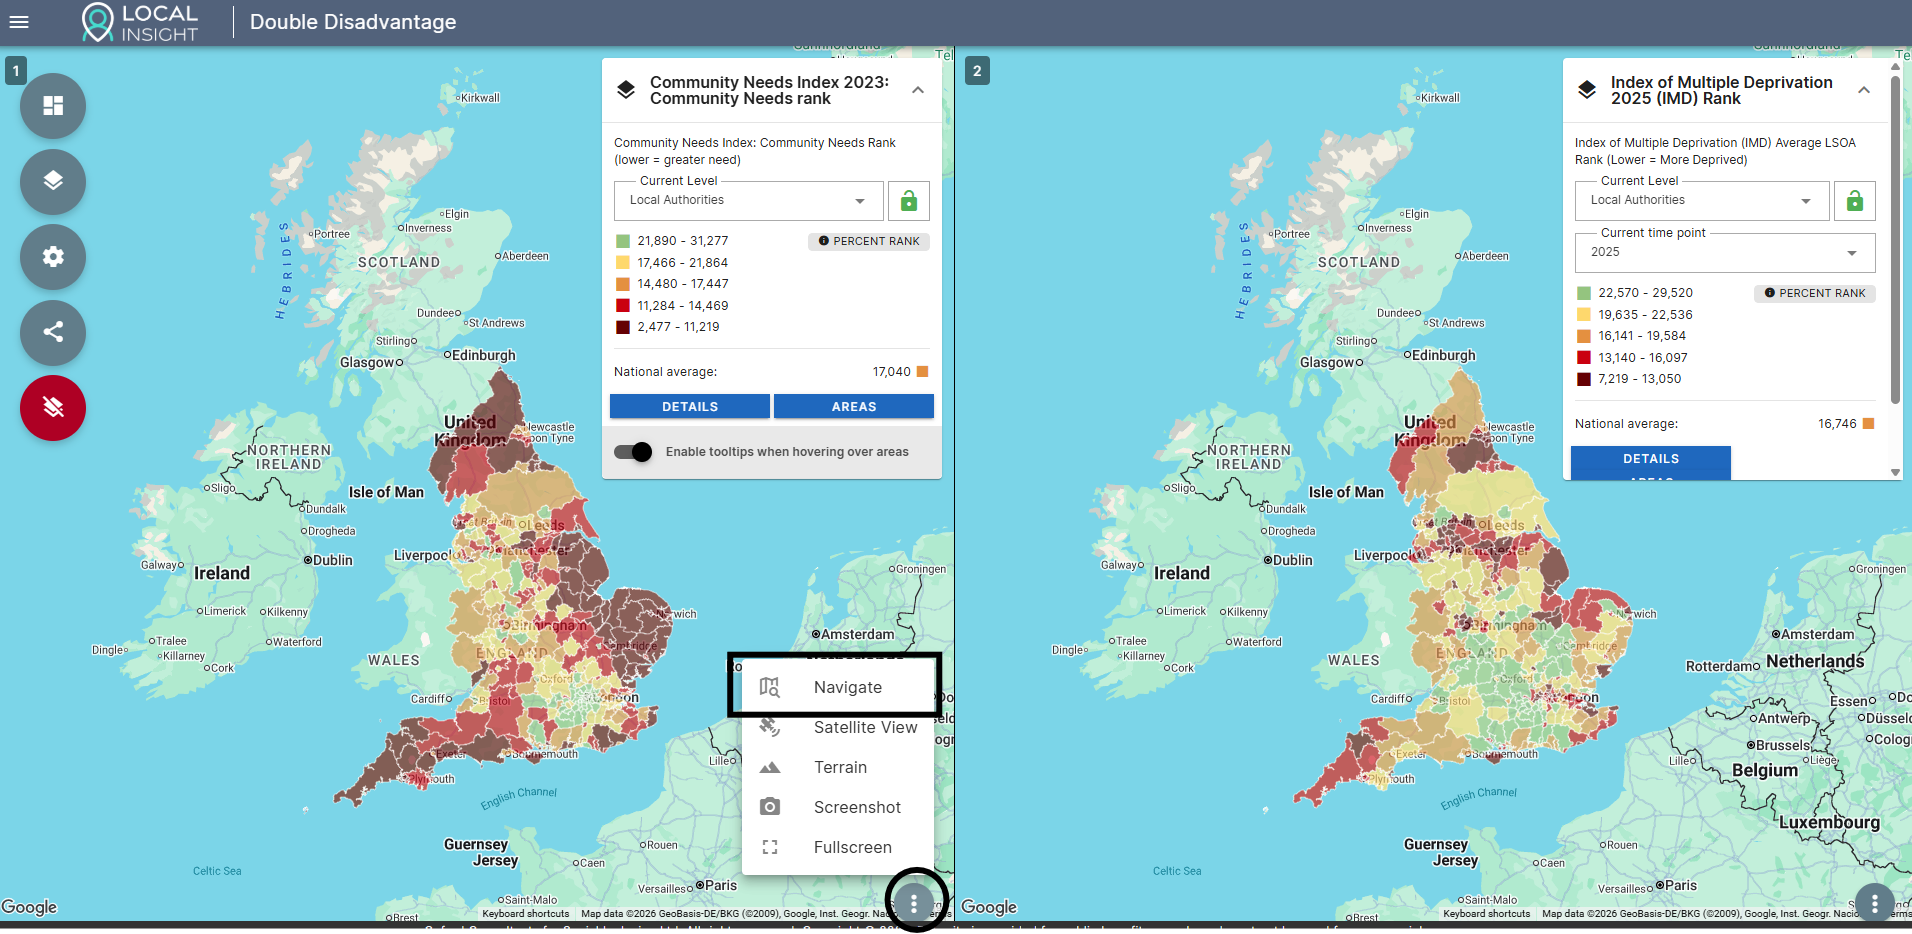
We have put together a freely available Double Disadvantage Explorer to help you identify how your neighbourhood ranks on both the IMD and the CNI.
This guide gives step-by step guidance on how to access and interpret the data.
For more in-depth analysis on the CNI, IMD and wider socio-economic and demographic factors that can support your bids, take a look at OCSI On Demand.
The Index of Multiple Deprivation (IMD) measures relative deprivation across England, bringing together information on income, employment, health, education, crime, housing and living environment.
The Community Needs Index (CNI) complements this by measuring factors linked to community resilience and social infrastructure, such as civic assets, connectedness and engagement.
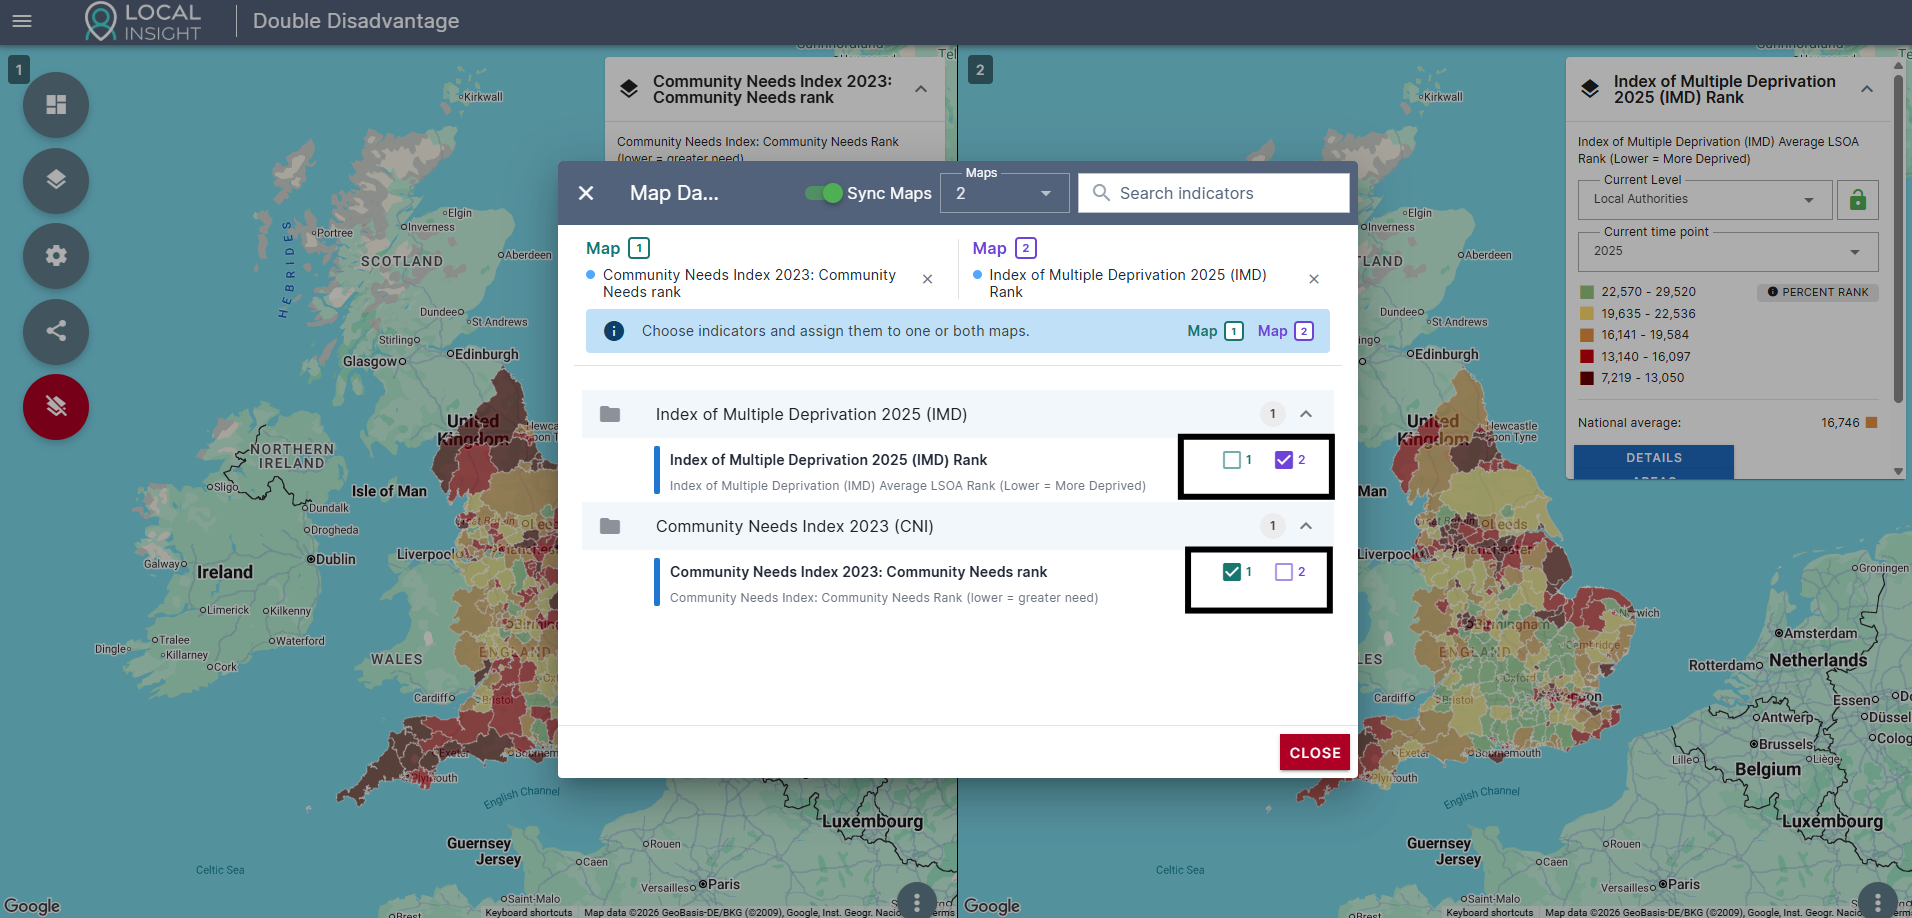
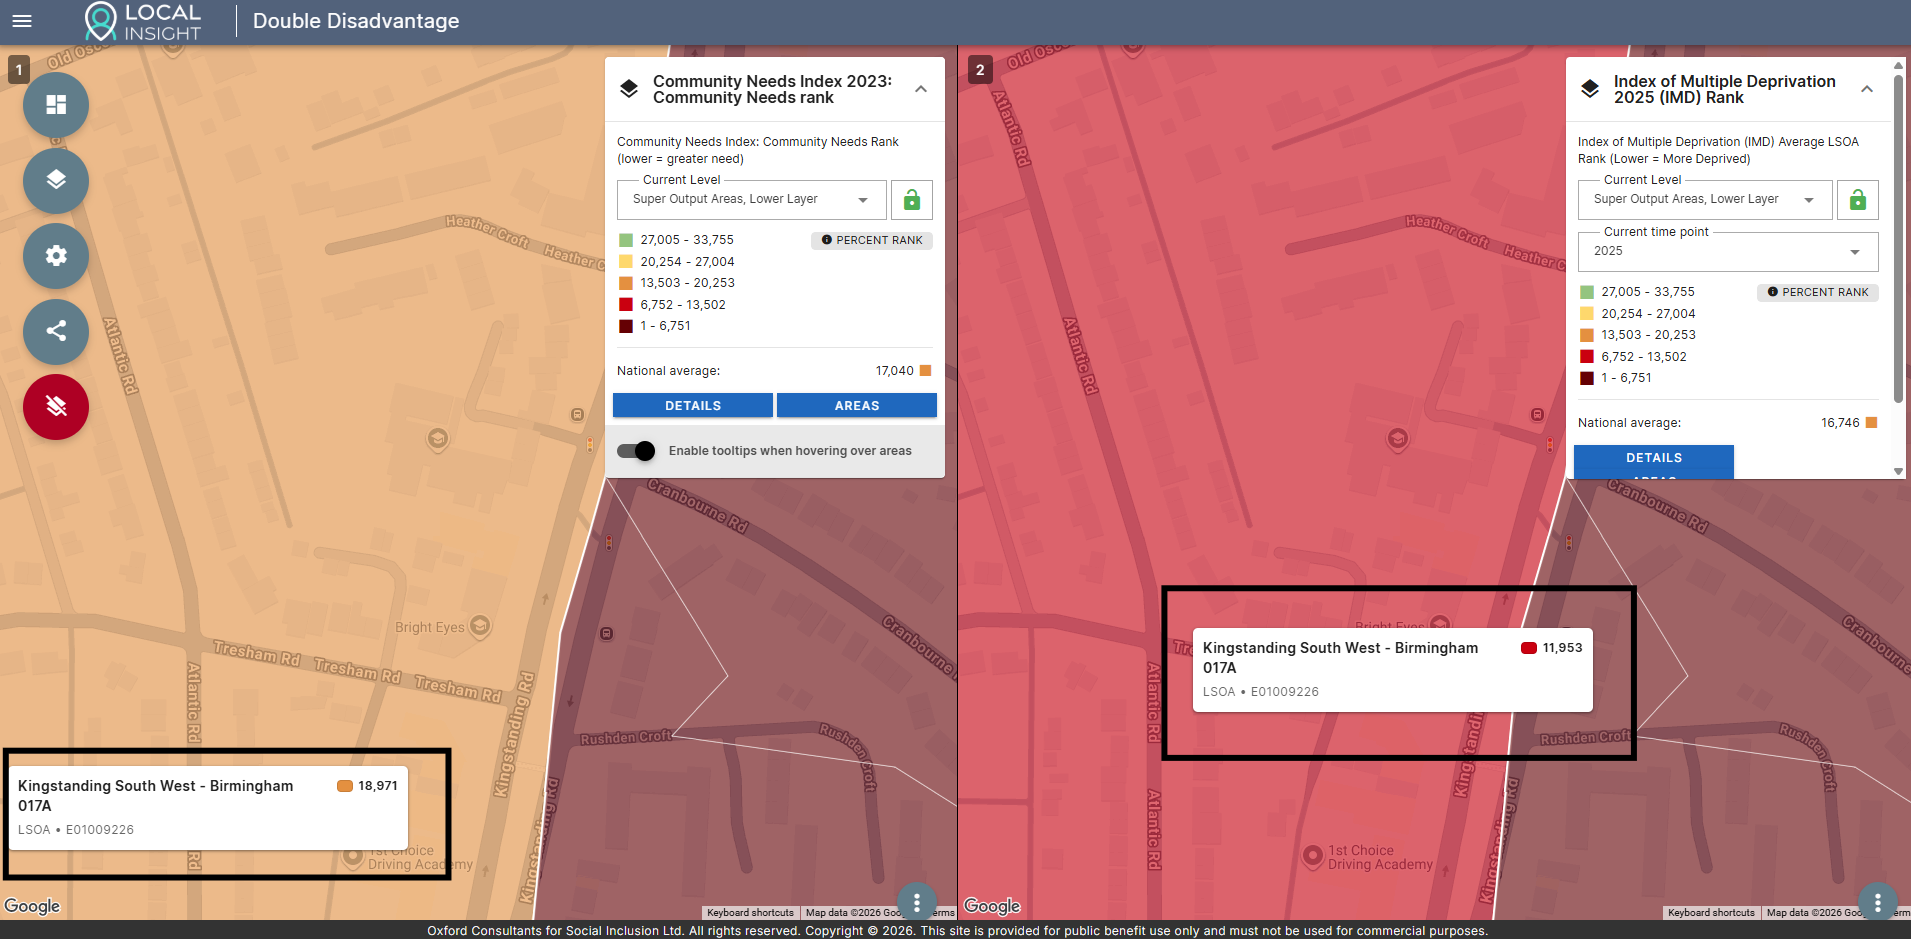
Looking at both measures together provides a more complete picture of need within a neighbourhood. Neighbourhoods that fall in the bottom of both measures can be described as experiencing “double disadvantage”. Organisations use different criteria for this – but often this is described as neighbourhoods that fall within the bottom 20% on both measures.
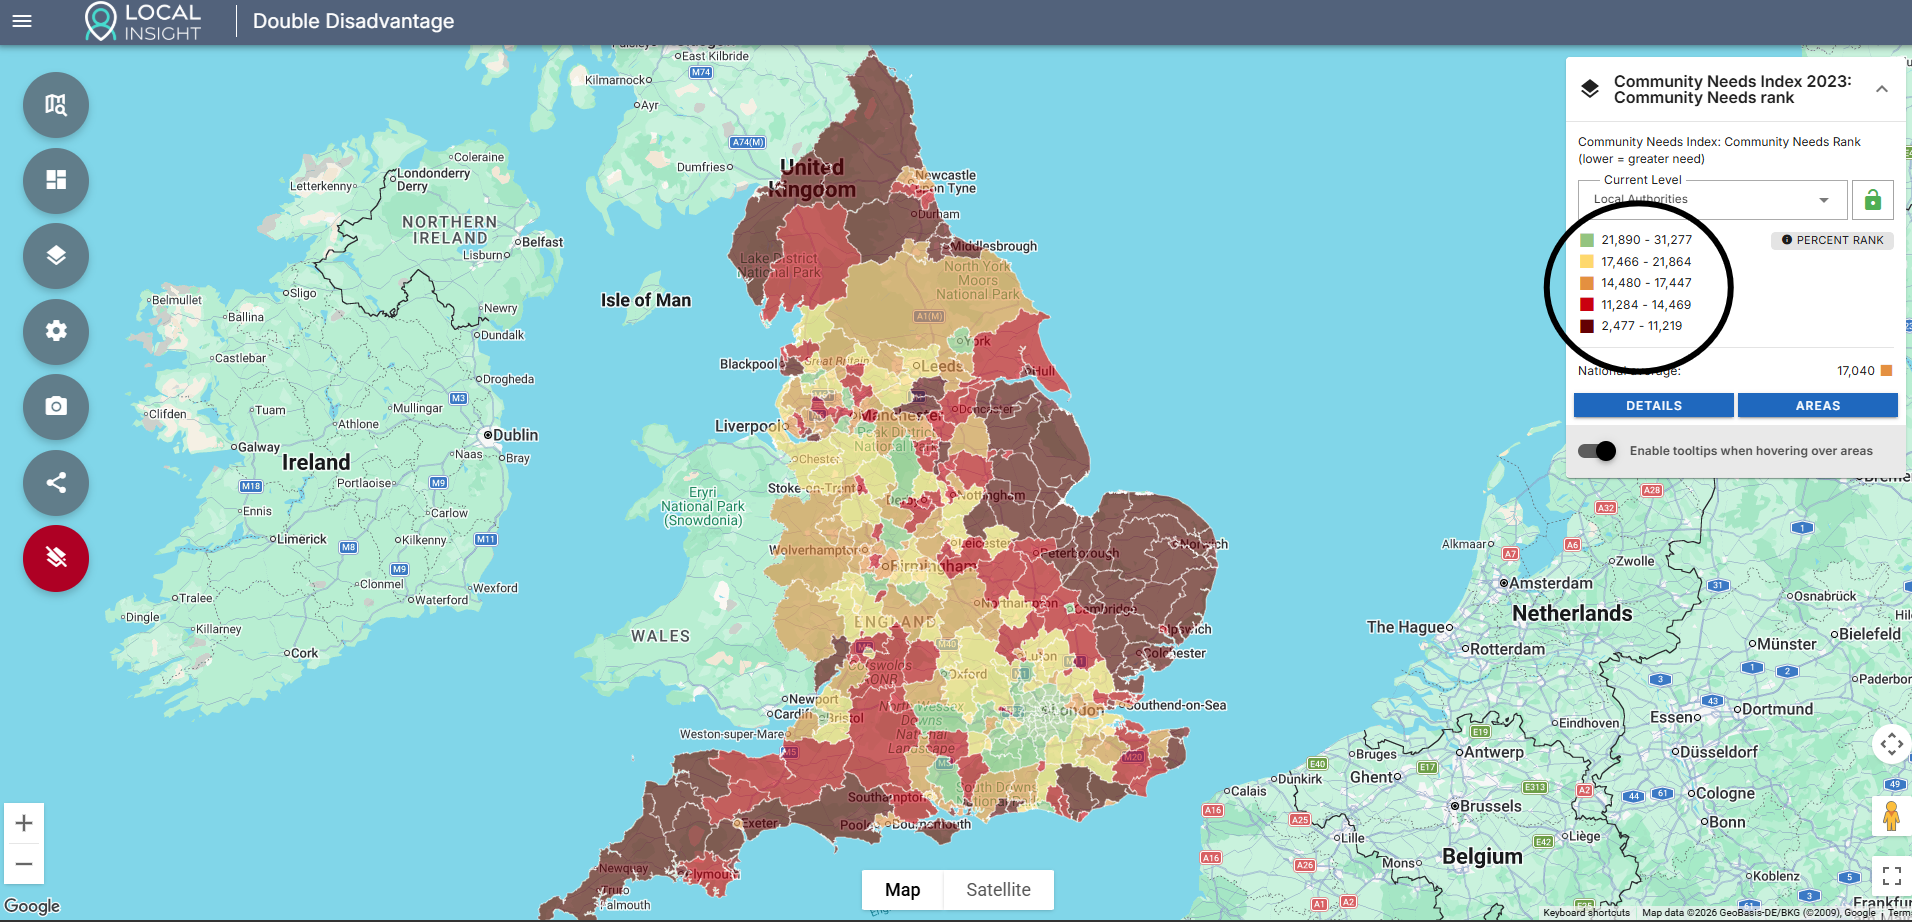
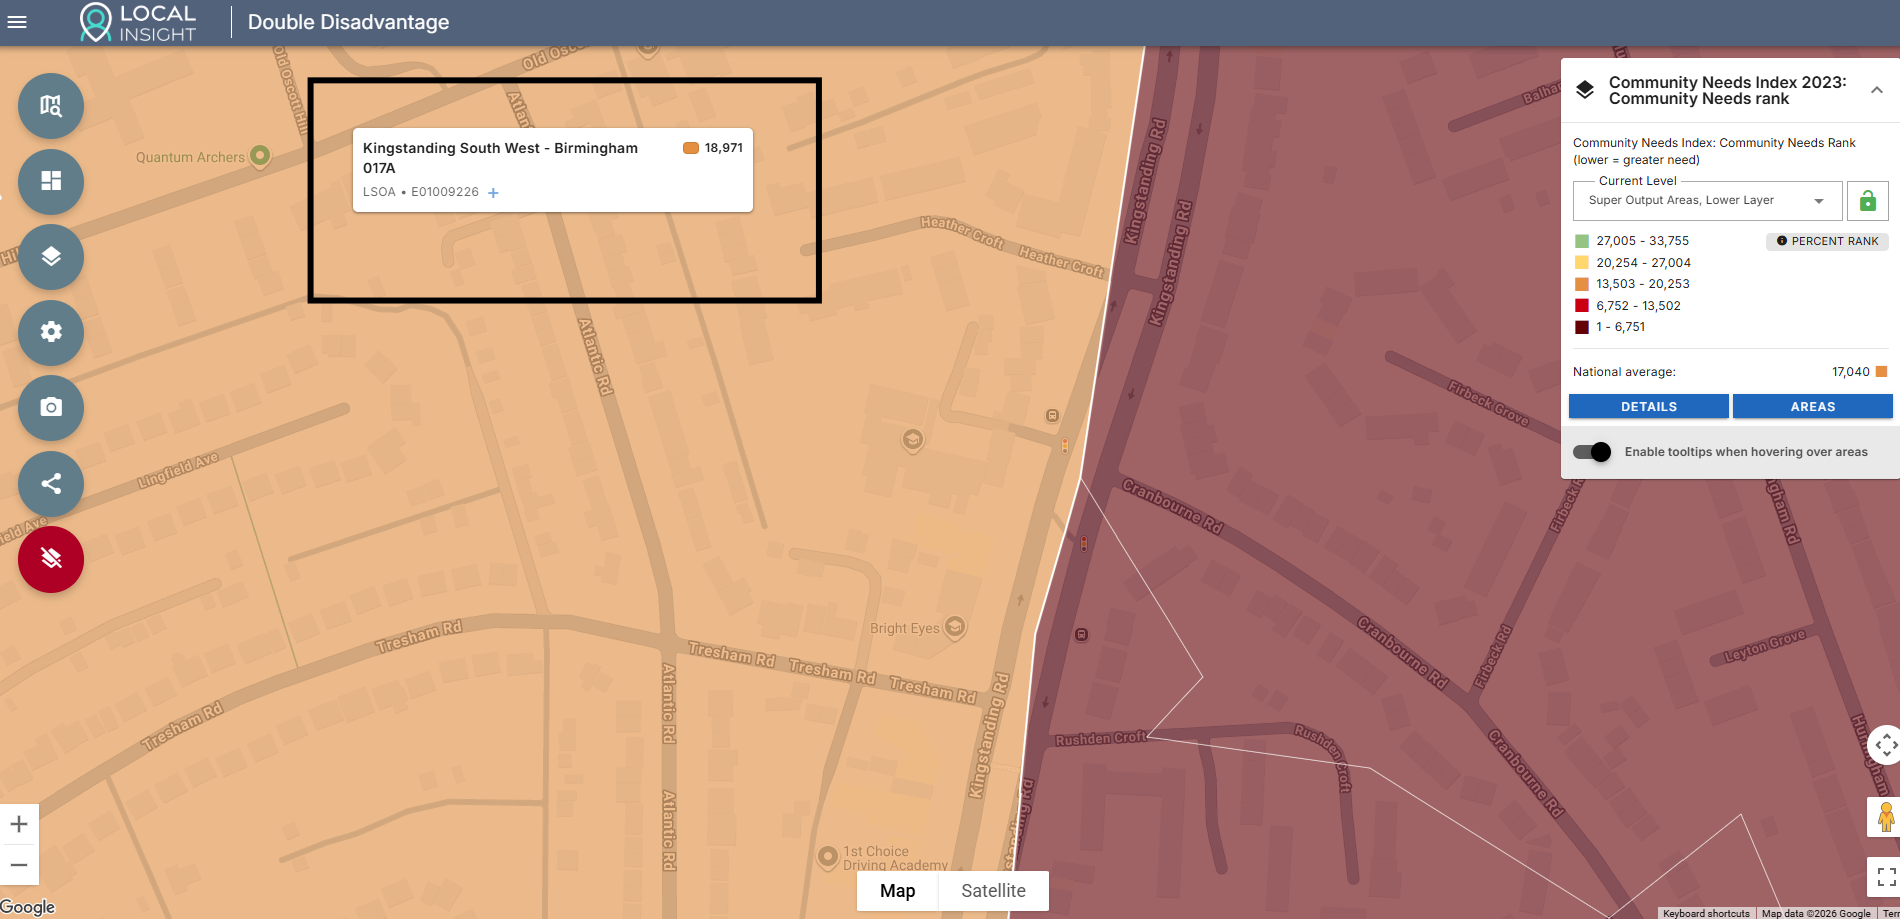
Both the IMD and CNI rank each Lower Super Output Area (LSOA) from most deprived / highest community need (rank of 1) to least deprived / lowest community need (rank of 33,755).
Funders will usually ask you to demonstrate whether there is high need in your area – and often this is expressed in terms of percentages (e.g. in the bottom 20% on the CNI) or in terms of deciles (e.g. in deciles 1 – 3 of the IMD).
The table below shows which ranks correspond to which deciles and percentages.
| Decile | Percentage | LSOA ranks for IMD / CNI |
|---|---|---|
| 1 | 0-10% | 1 - 3,375 |
| 2 | 10-20% | 3,376 - 6,751 |
| 3 | 20-30% | 6,752 - 10,127 |
| 4 | 30-40% | 10,128 - 13,502 |
| 5 | 40-50% | 13,503 - 16,878 |
| 6 | 50-60% | 16,879 - 20,253 |
| 7 | 60-70% | 20,254 - 23,629 |
| 8 | 70-80% | 23,630 - 27,004 |
| 9 | 80-90% | 27,005 - 30,380 |
| 10 | 90-100% | 30,381 - 33,755 |
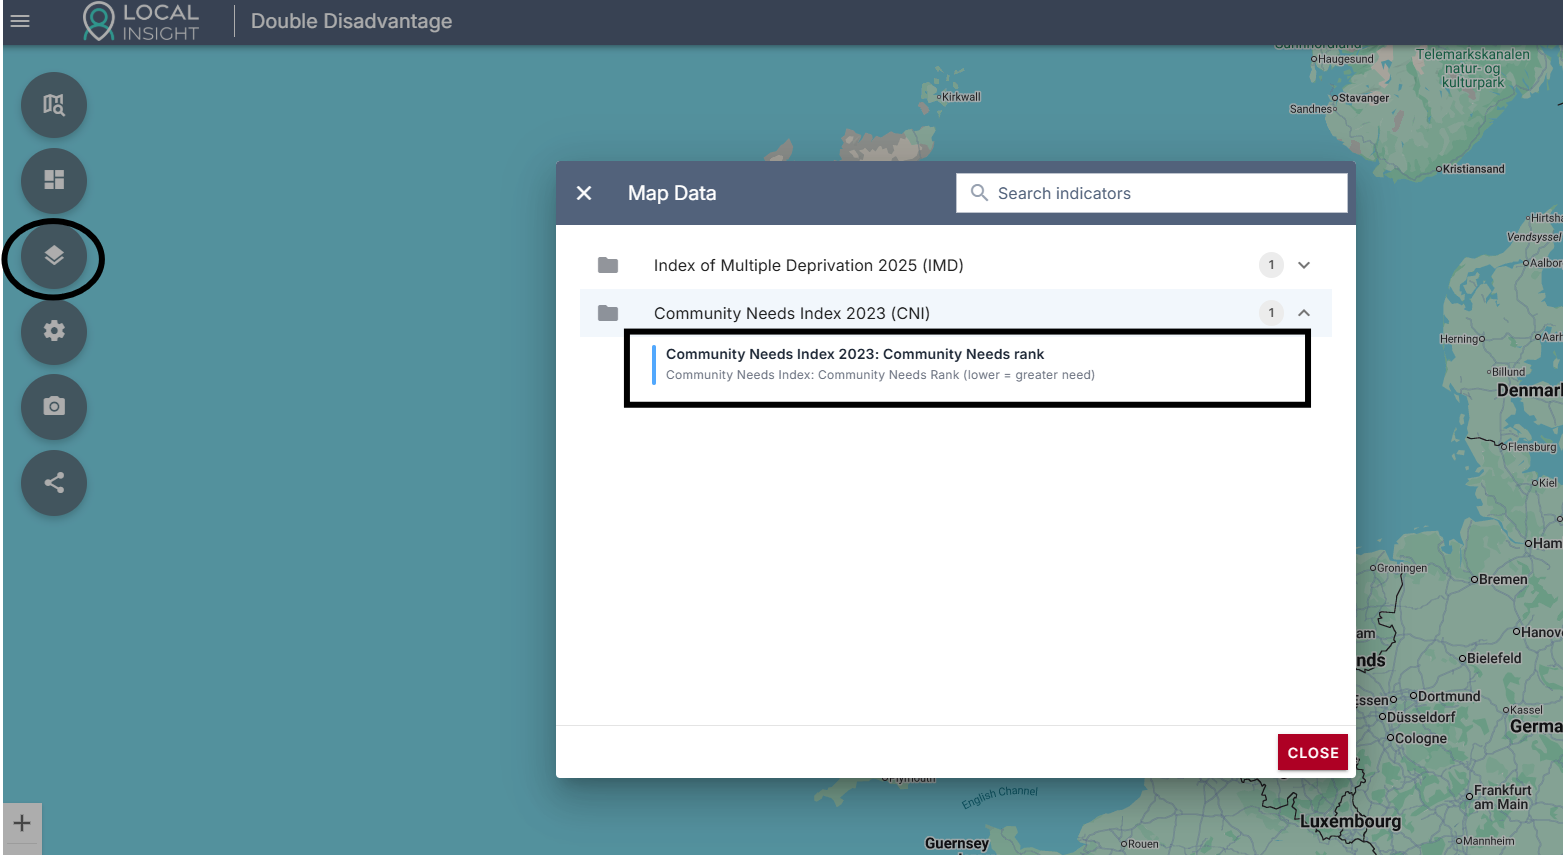
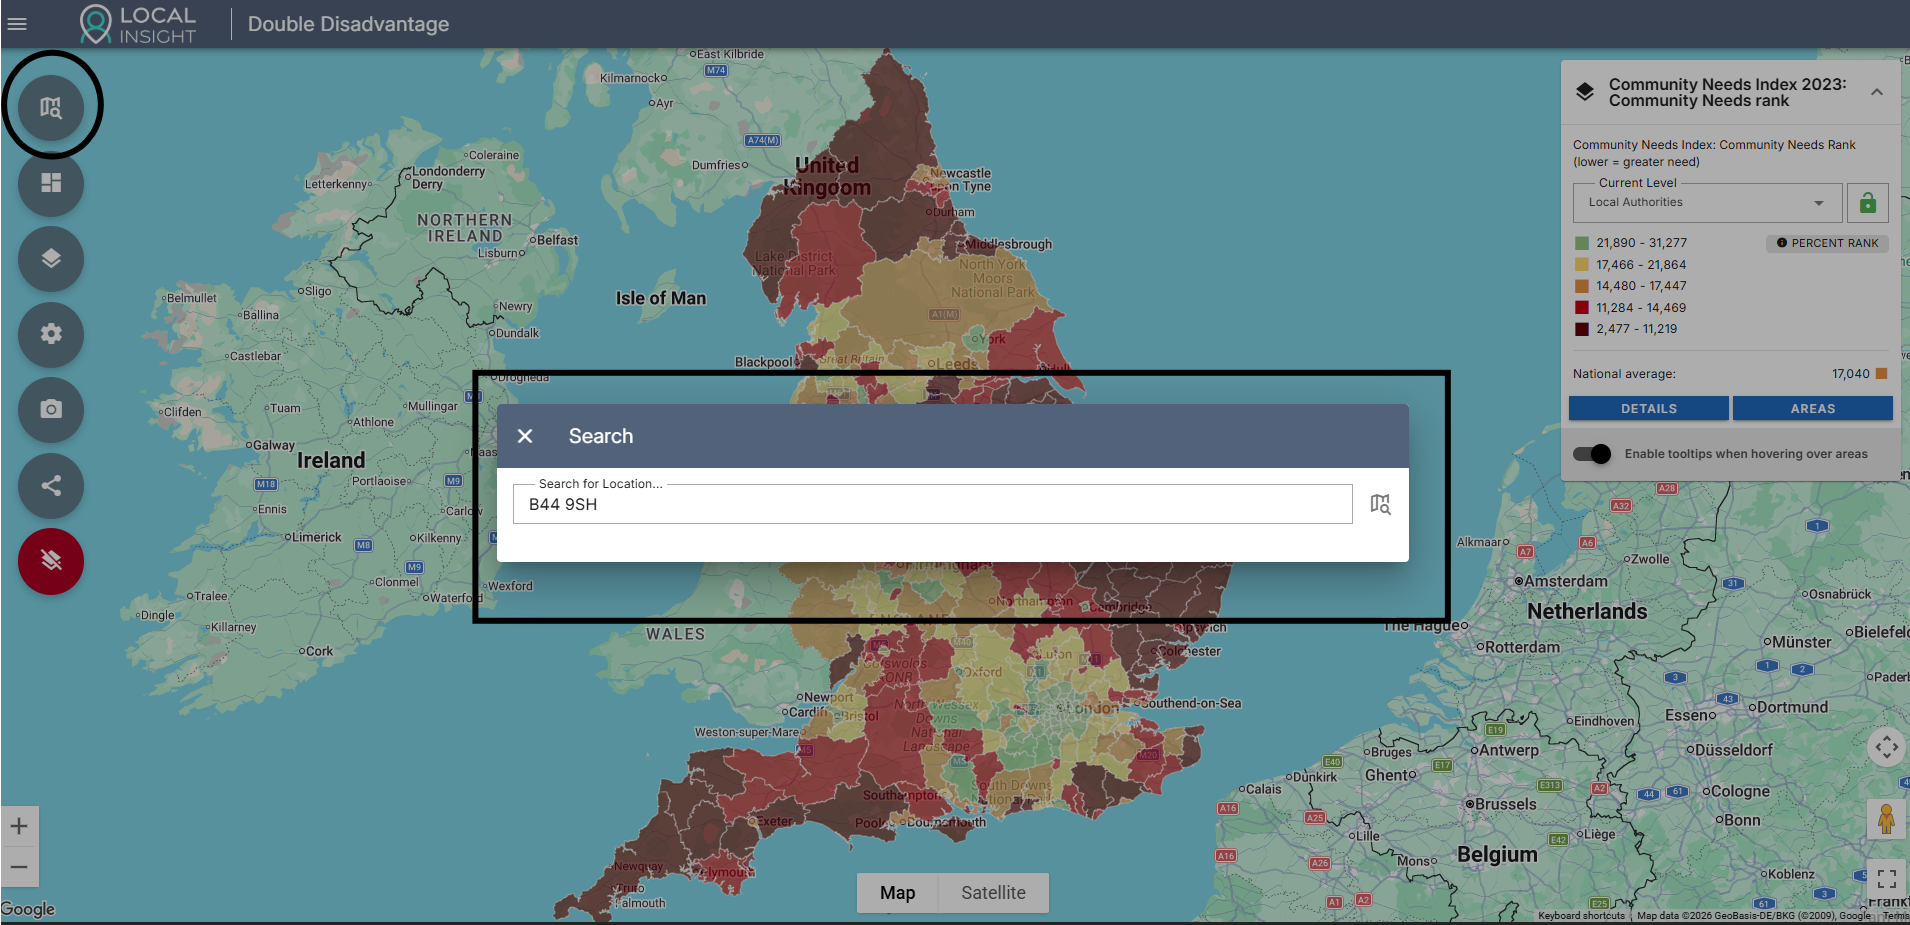
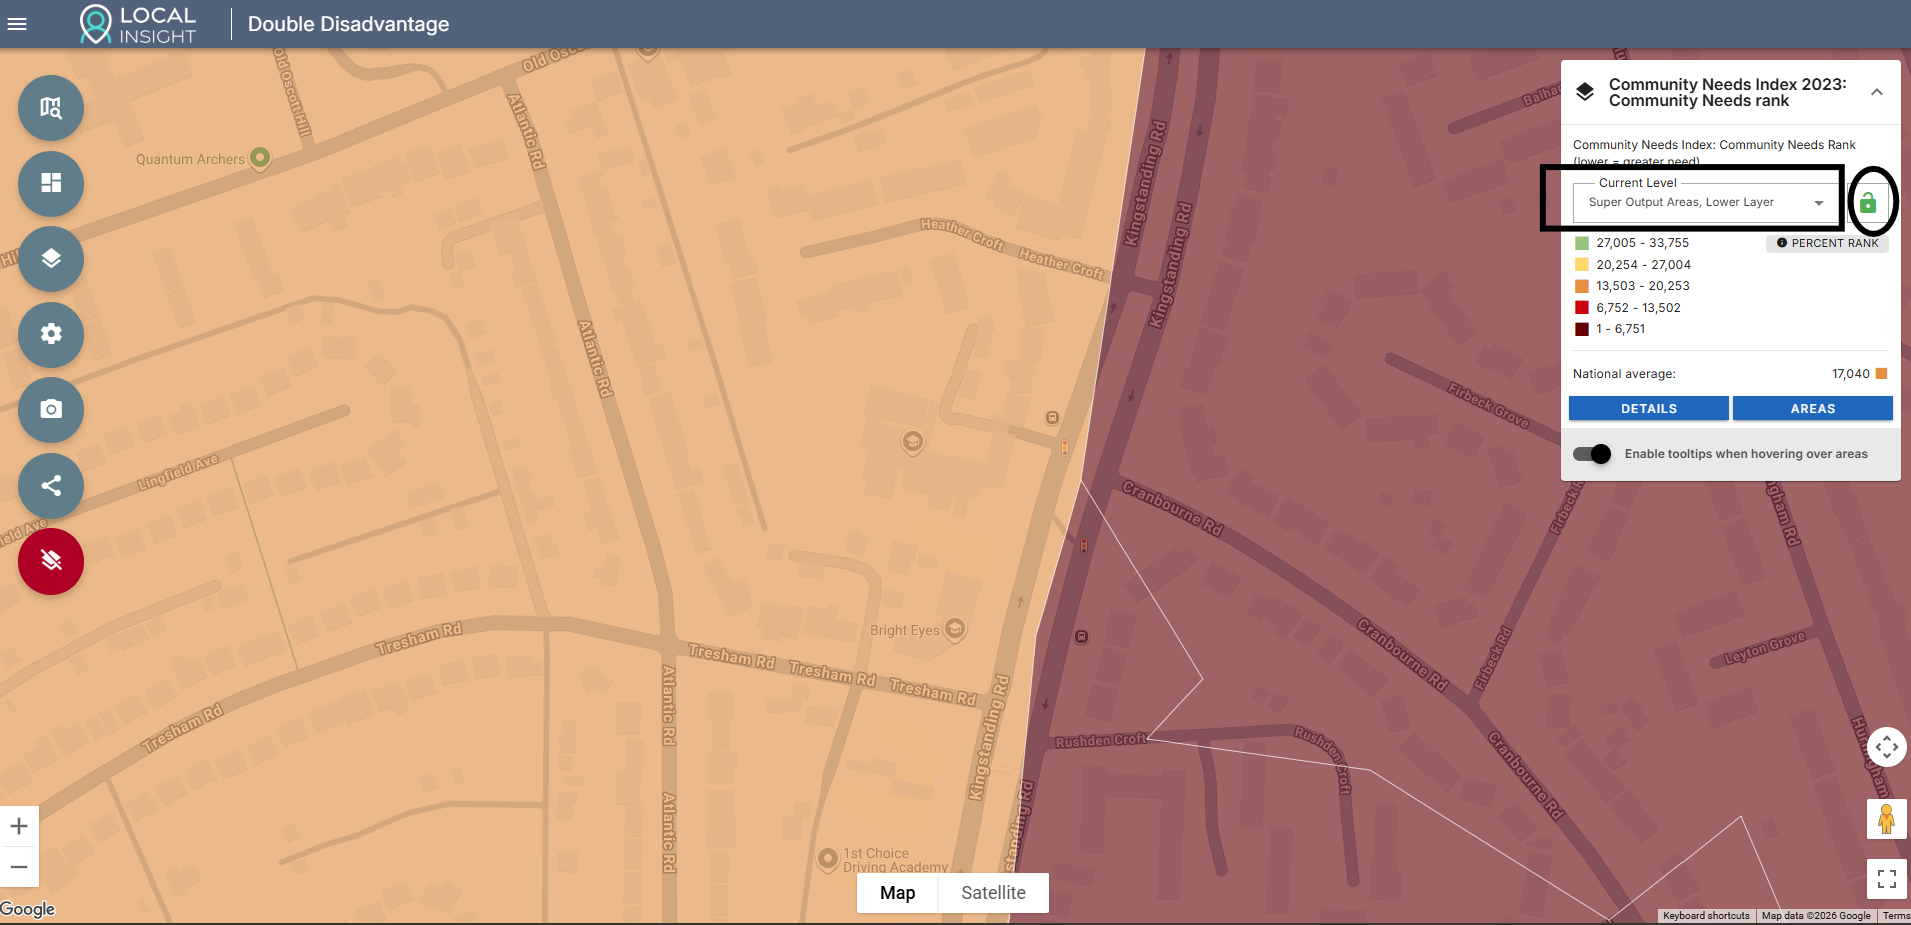
First, open the Double Disadvantage Explorer in your browser.
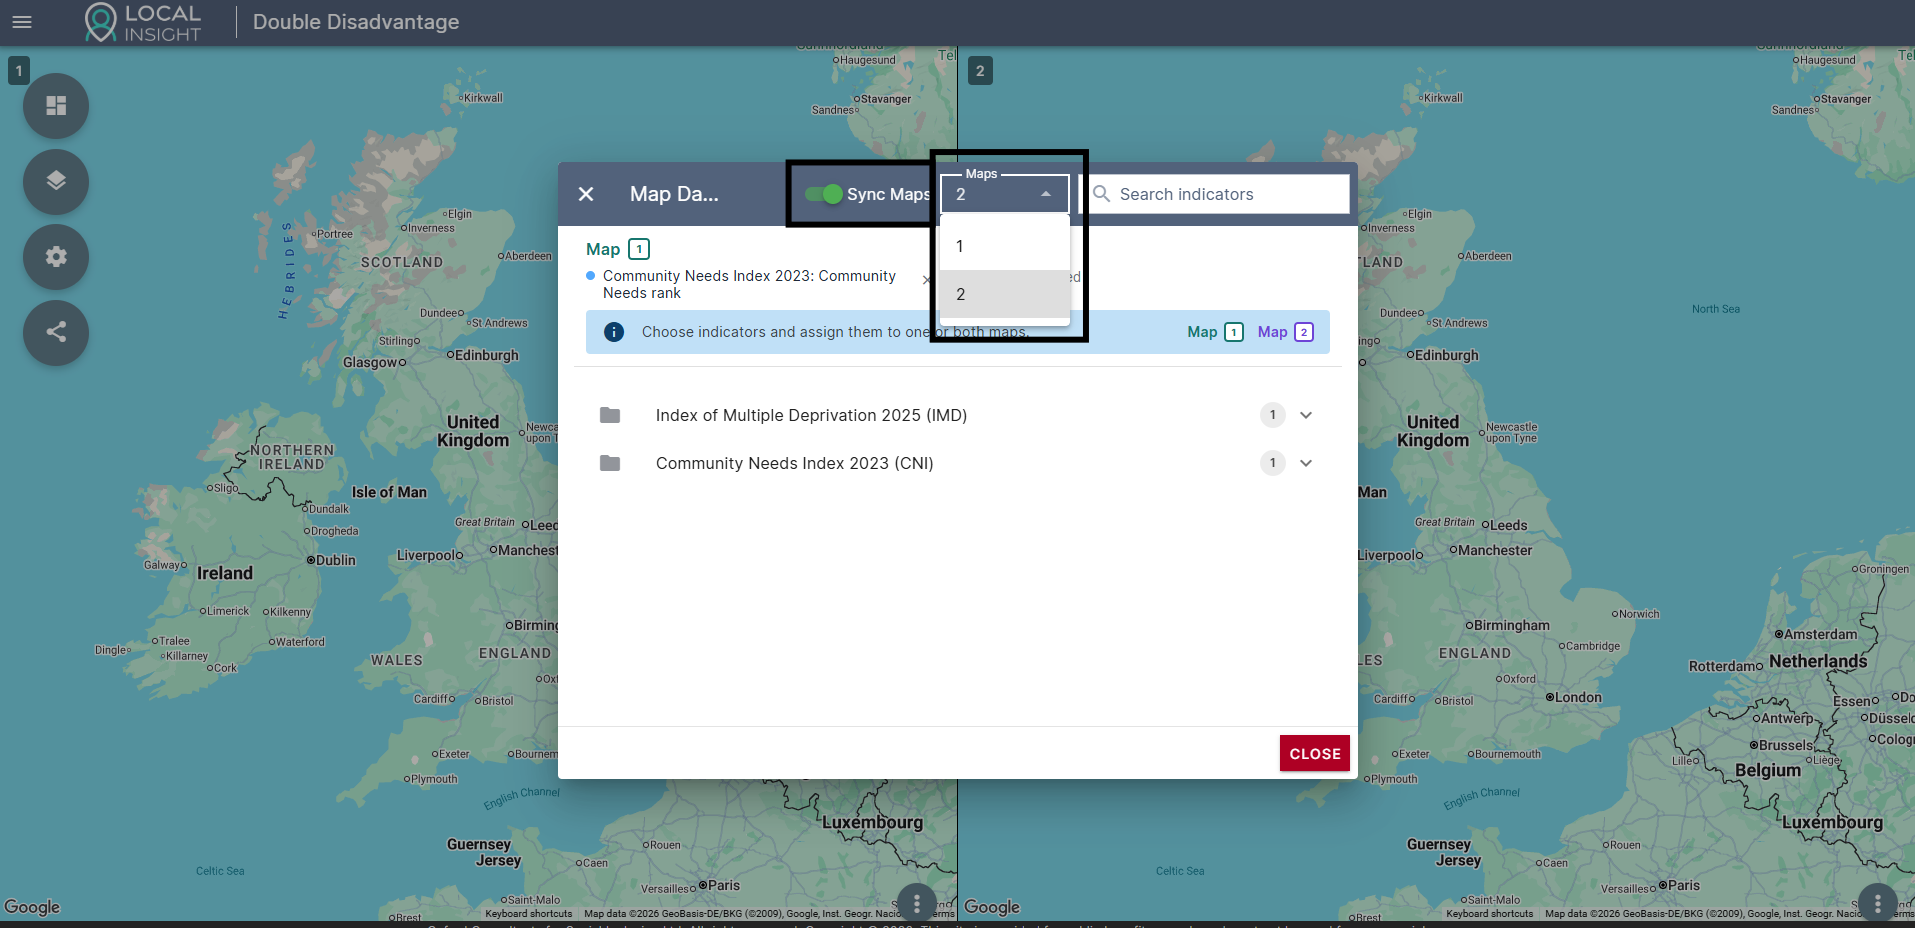
The guide below shows you how to explore each indicator individually and how to view the indicators side-by-side.
If you would like to strengthen your funding bids further with broader evidence about your local area, take a look at OCSI On Demand.
Our trusted area profile reports are designed for charities that need robust evidence to back up their local knowledge – without the commitment or cost of subscriptions and consultancy.
The reports give key insights into a wide range of themes including deprivation, community need, health, crime, employment, living environment, housing and more – giving you the numbers you need to complement on-the-ground knowledge of your communities.
View sample reports and build your own here.

The English Community Needs Index (CNI) 2023 is now published as open…
More
Social housing providers have deep, experience-based knowledge of the communities they serve….
More
The results of the May 2026 local elections provided plenty to reflect…
More