Recent research from Imperial College London, the Met Office and the London School of Hygiene & Tropical Medicine estimated that more than 2,700 people died from heat-related causes during the May and June 2026 heatwaves in England and Wales, with around 42% of those deaths attributable to the additional heat associated with human-induced climate change.
The same period of hot weather can pose very different risks from one neighbourhood to another, depending on who lives there, the homes they live in, the surrounding environment and the resources people have to prepare for and respond to heat.
Drawing on Friends of the Earth’s research into neighbourhood vulnerability to heatwaves, alongside wider evidence on the factors that shape susceptibility, exposure and people’s capacity to adapt, we developed a new Extreme Heat Vulnerability Index for all 33,755 LSOAs in England.
The Index brings these different factors together to identify where the conditions associated with greater vulnerability are most concentrated.
Overall vulnerability is highest in Inner London. But looking across the individual domains shows a more varied geography, with different factors shaping vulnerability in different parts of the country.
Find out how we developed the Extreme Heat Vulnerability Index
London dominates the Local Authorities with the highest average Extreme Heat Vulnerability.
Eighteen of the 20 highest-ranking Local Authorities are London boroughs. Cambridge and Slough are the only exceptions.
The concentration is strongest at the top. England’s seven Local Authorities with the highest average vulnerability are:
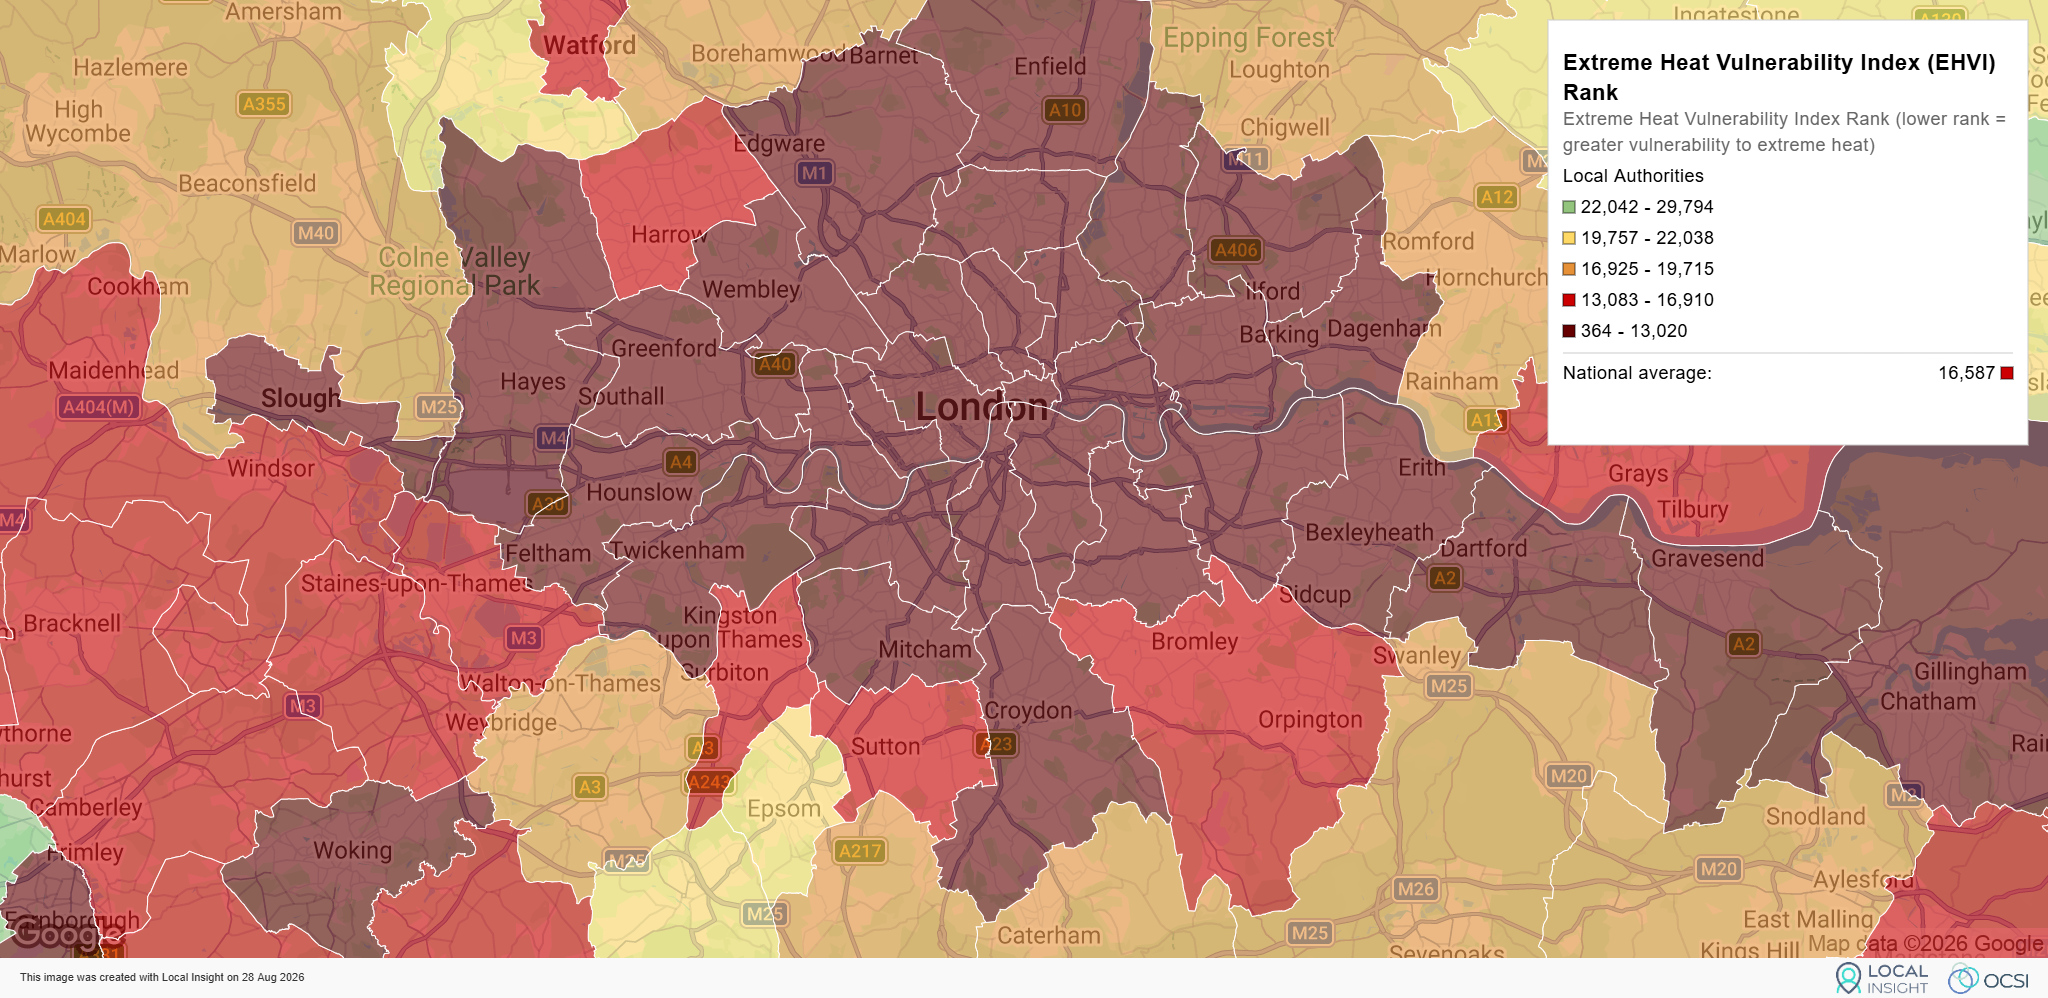
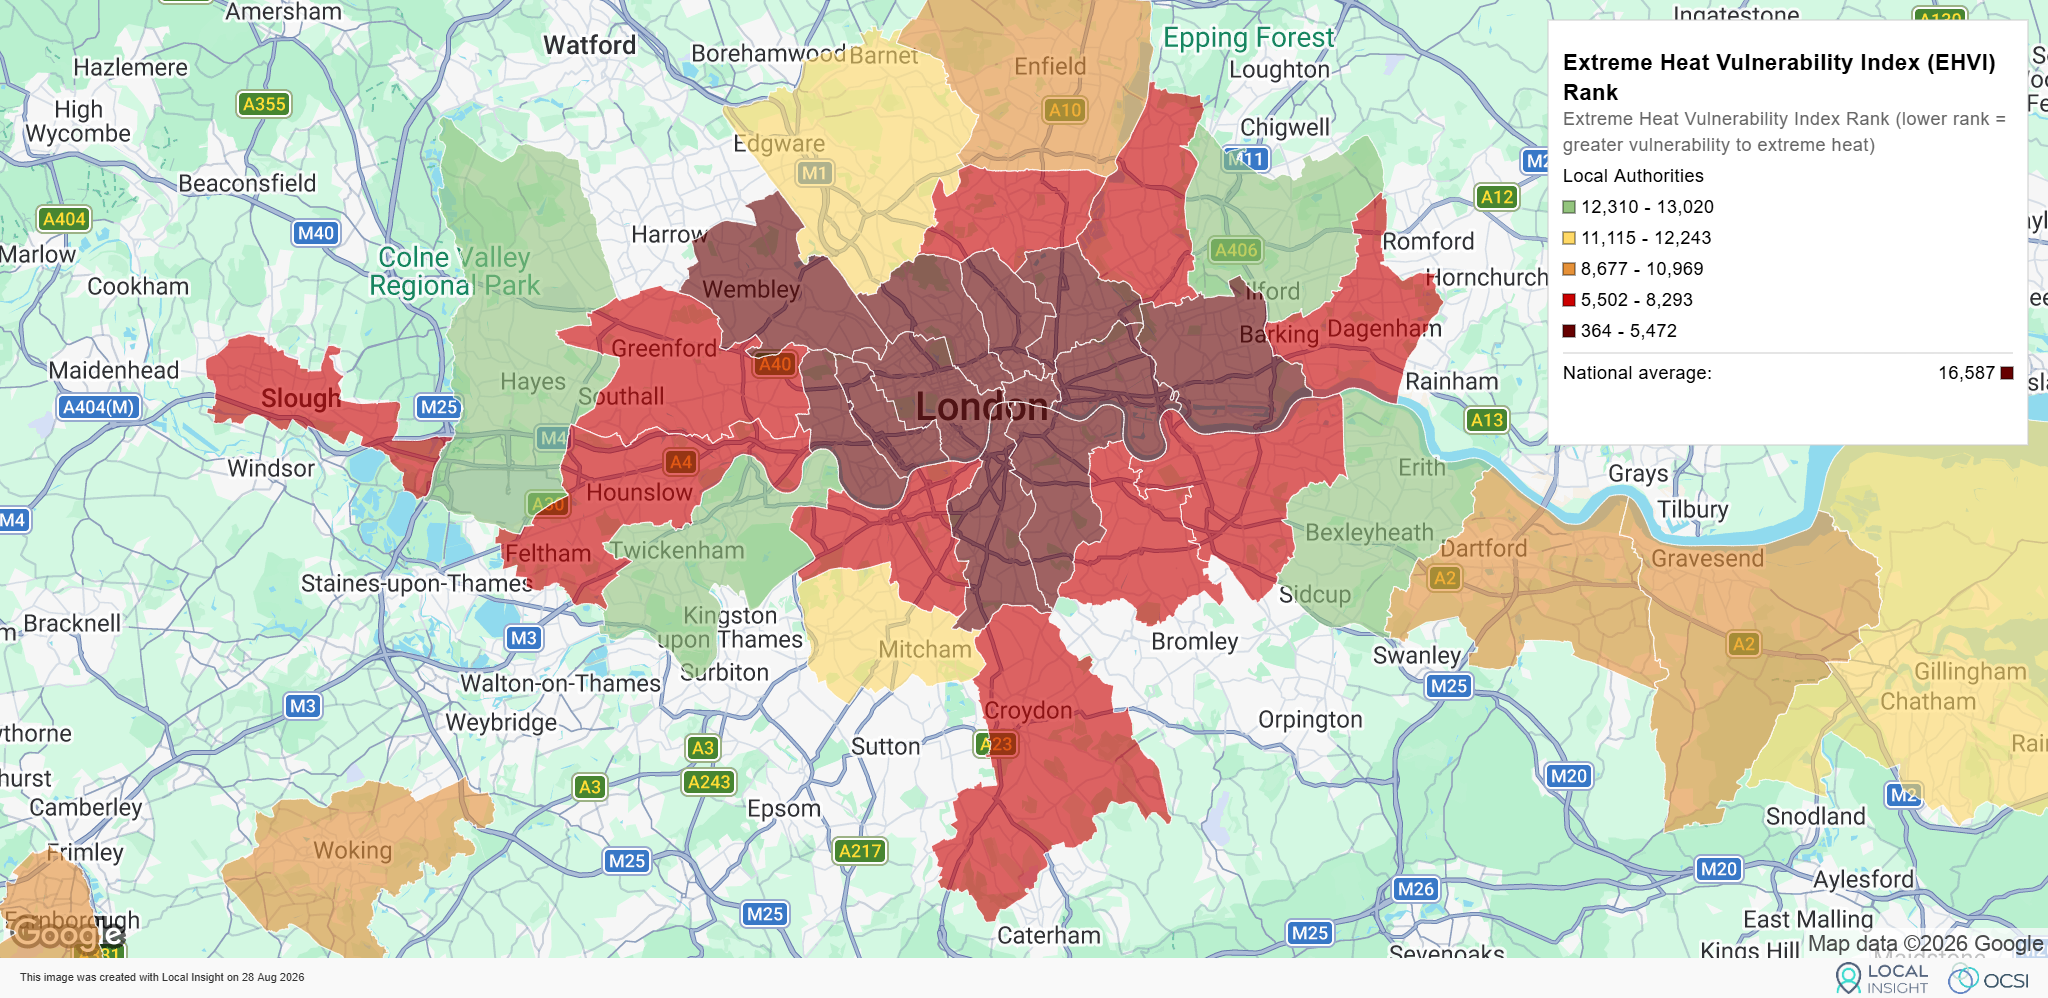
Together these boroughs make up much of London’s inner urban core. The first map shows how local authorities in and around London rank on the Extreme Heat Vulnerability Index compared with all local authorities in England. The second isolates those that fall within the 20% most vulnerable nationally.
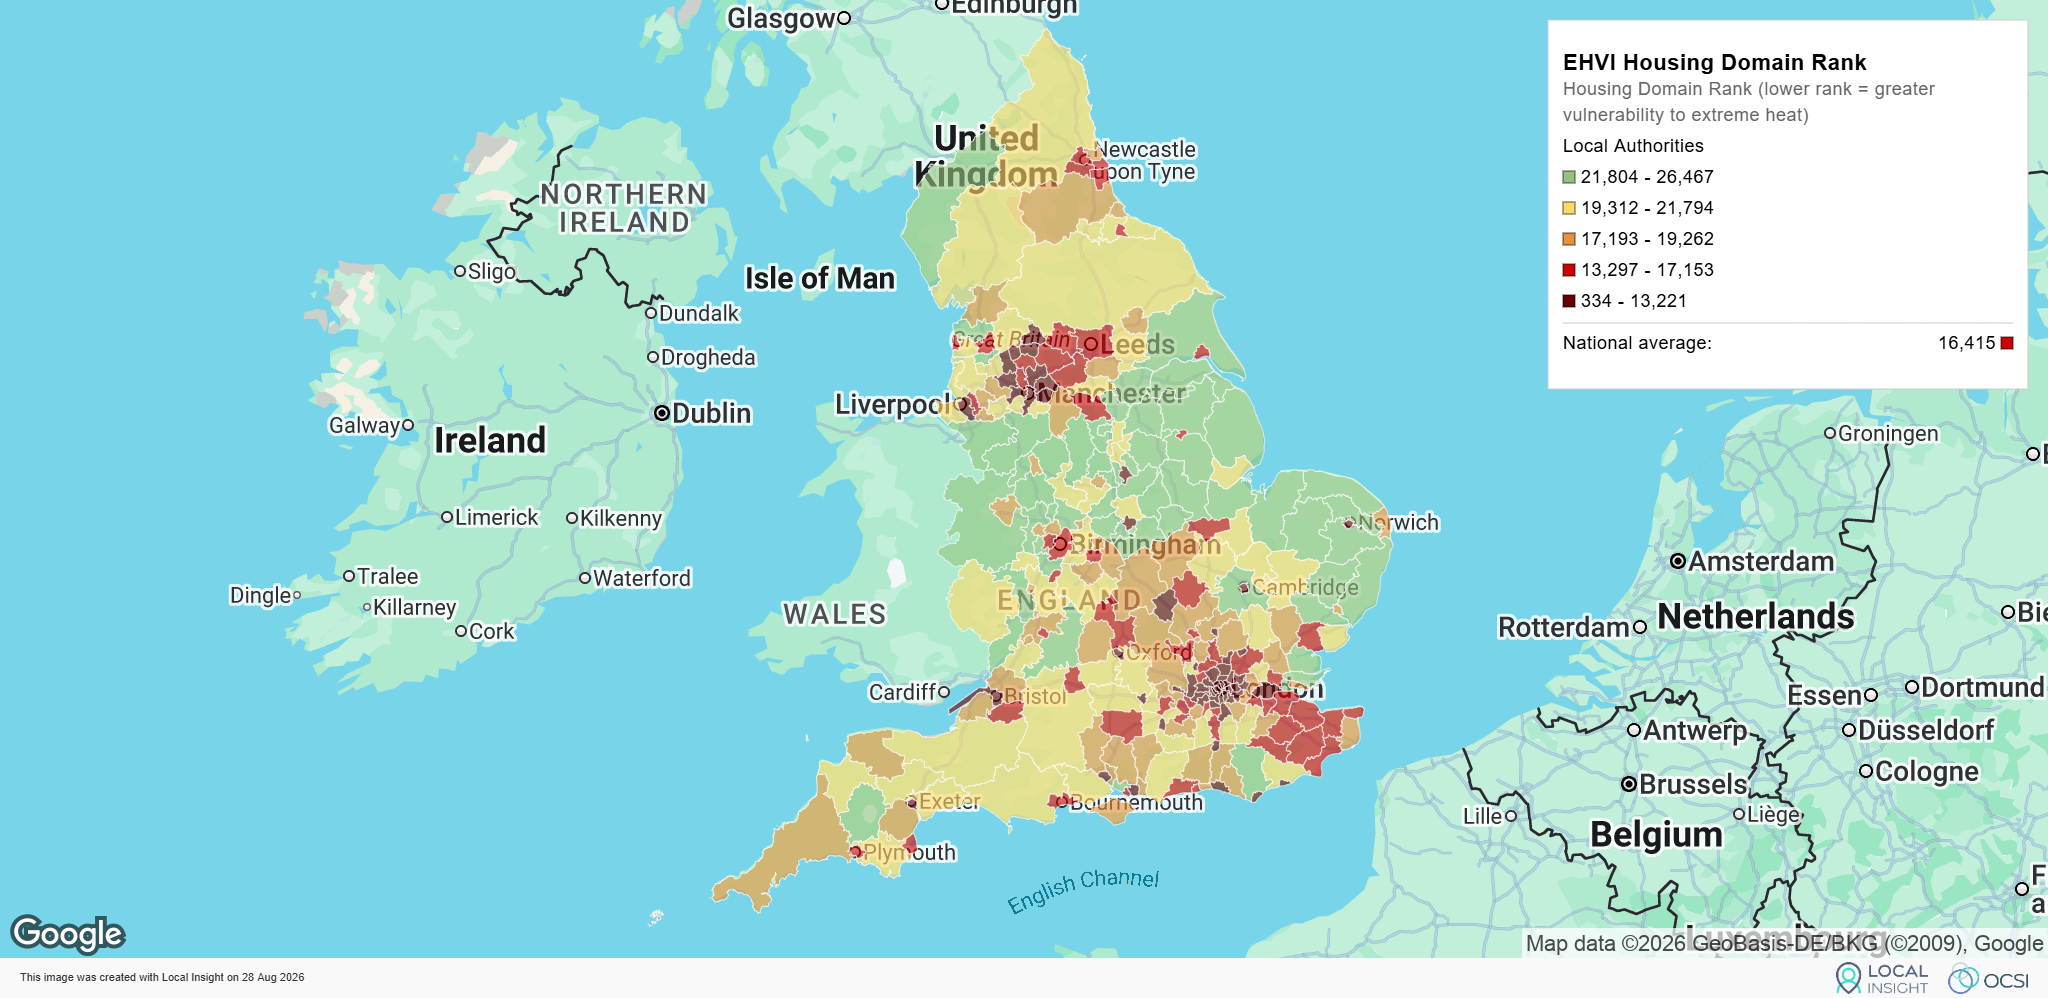
Housing vulnerability is particularly concentrated in London. Across England, 19 of the 20 Local Authorities with the highest Housing vulnerability are London boroughs, with Slough the only exception.
The Outdoor Environment domain shows a similar pattern. Kensington and Chelsea ranks first nationally, Hammersmith and Fulham second and Westminster third.
Dense urban housing, overcrowding, limited private outdoor space, lower tree cover and other environmental pressures therefore combine to create a distinctive form of vulnerability in the capital. This helps explain why London has such a strong presence on the overall Index despite many boroughs ranking relatively low for Enhanced physical risk.
Among the 30 Local Authorities with the highest overall vulnerability, 22 are also among the 30 highest-ranking for Housing and 20 for the Outdoor Environment. None are among the 30 highest-ranking for Enhanced physical risk.
The map below shows London LSOAs ranked on the EHVI Housing domain relative to other neighbourhoods within London, highlighting local variation in housing-related vulnerability across the capital.
Not every high-vulnerability London borough has the same profile.
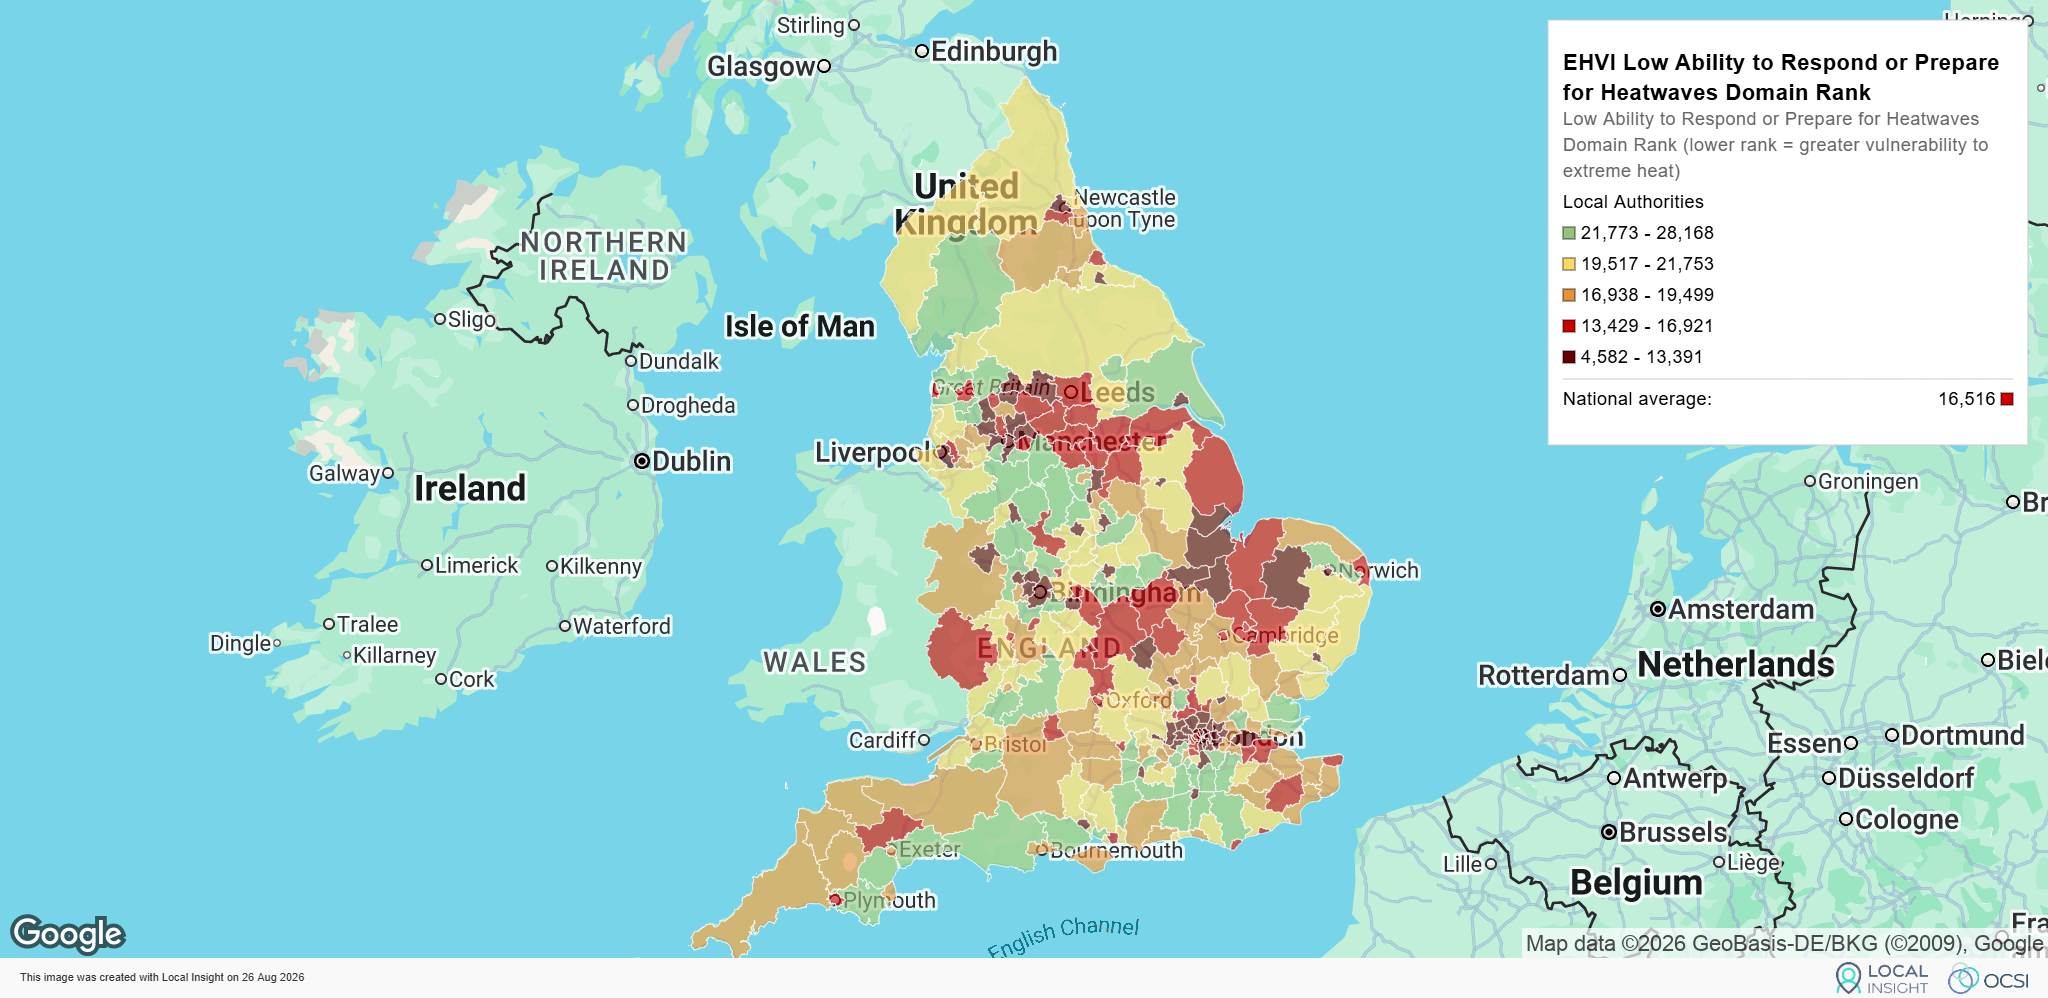
Newham has the highest vulnerability in England on the Low ability to respond or prepare domain, followed by Brent and Tower Hamlets.
Leicester, Barking and Dagenham, Boston, Hackney and Slough also feature among the areas experiencing the greatest challenges on this measure.
The domain reflects a combination of income deprivation, high levels of rented housing, language barriers and access to healthcare.
These factors can affect whether residents have the financial resources, information, control over their housing or access to services needed to respond effectively when temperatures rise.
Local Authority averages can hide substantial differences between communities, which is why we constructed the Index at neighbourhood level.
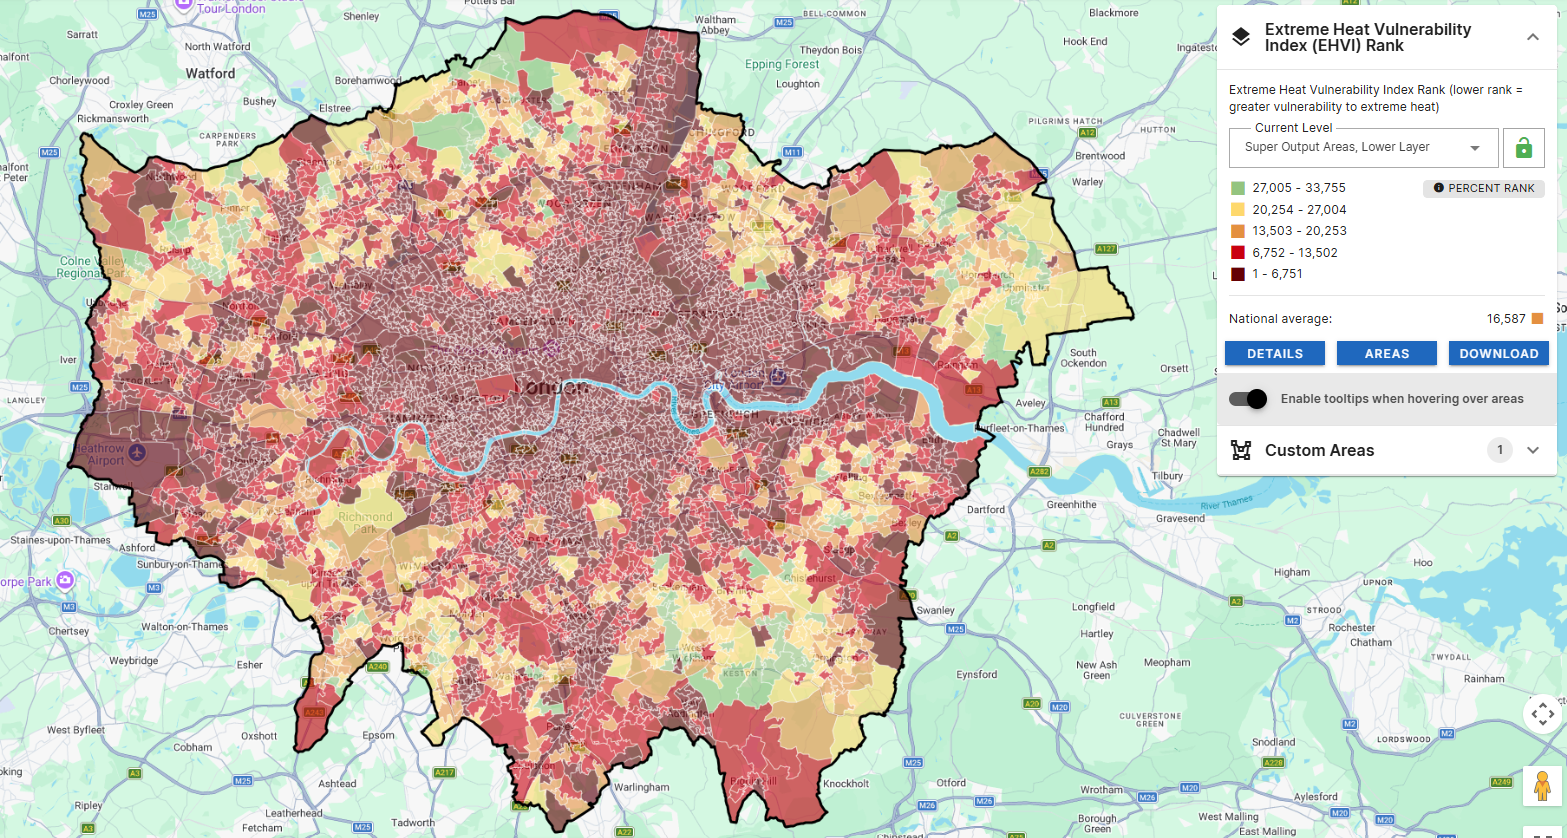
Eighteen of the 20 LSOAs with the highest Extreme Heat Vulnerability are in Inner London.
The most vulnerable neighbourhood in England is Finsbury Park West – Islington 005C.
Its position does not result from a single extreme score. Instead, vulnerability accumulates across several domains, including access to cool spaces, ability to respond and prepare, and housing.
Camden is particularly prominent. Three neighbourhoods in Kilburn East appear among England’s ten most vulnerable, alongside Kentish Town West.
Somers Town – Portsmouth 018A is the second most vulnerable neighbourhood nationally. Here, ability to respond or prepare and Enhanced physical risk play a substantially greater role than they do in many of the Inner London neighbourhoods at the top of the Index.
Across the most vulnerable 10% of neighbourhoods overall, 57% are also in the most vulnerable 10% for Housing, 49% for Low ability to respond or prepare and 45% for the Outdoor Environment. Only 23% are in the most vulnerable 10% for Enhanced physical risk.
The map below shows London LSOAs shown by their national EHVI rank, with each LSOA ranked against LSOAs across England.
The geography changes considerably when we look specifically at Enhanced physical risk.
Here, coastal and seaside communities become much more prominent.
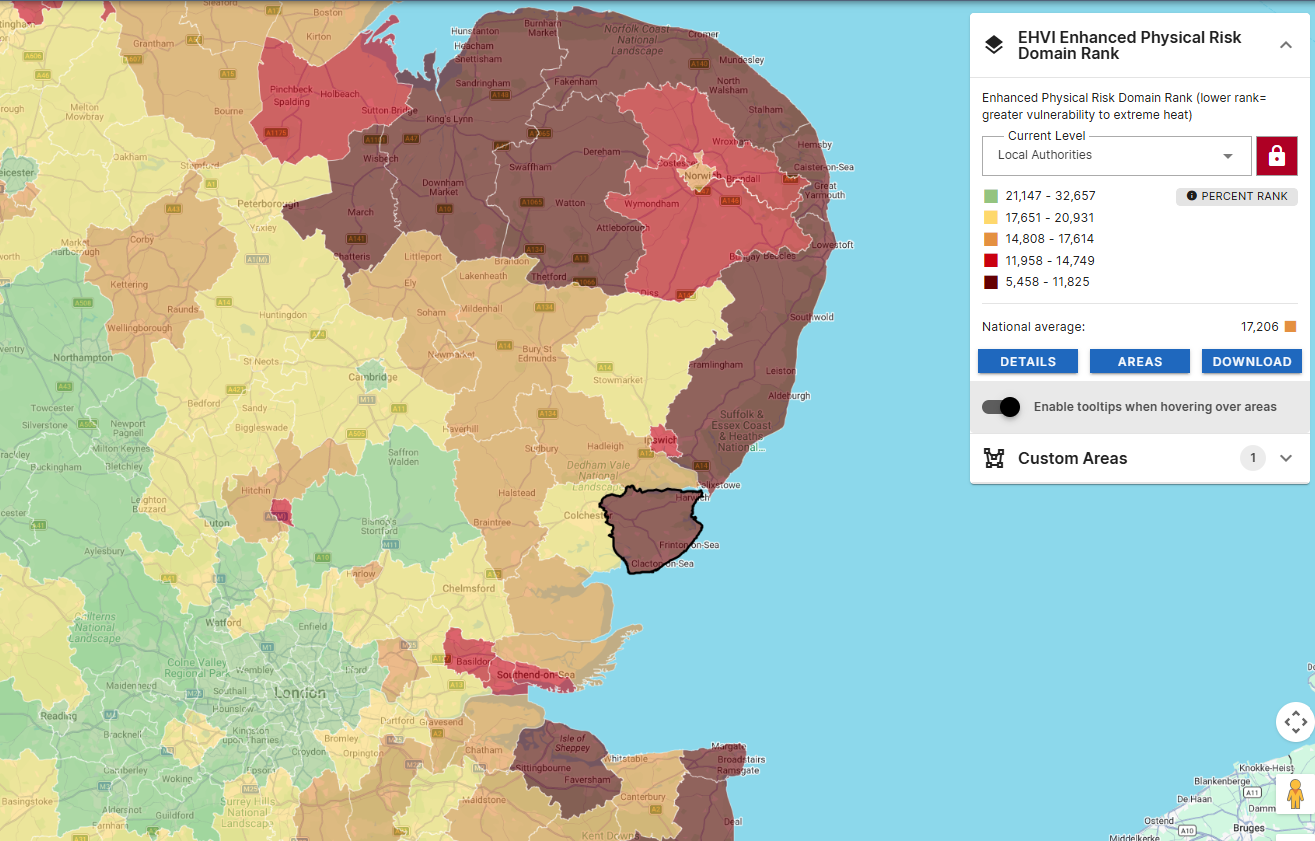
Tendring ranks first nationally, followed by Blackpool and East Lindsey. Thanet, Torbay, Rother, Great Yarmouth and North Norfolk also rank highly.
This reflects the characteristics captured in the domain, particularly larger proportions of older residents and people with long-term health conditions or disabilities.
However, it is important not to equate coastal location itself with greater heat vulnerability. Tendring ranks first for Enhanced physical risk but 87th overall. Blackpool ranks second for physical risk but 70th overall, while East Lindsey ranks third for physical risk and 109th overall.
None of the 30 Local Authorities with the highest Enhanced physical risk are among the 30 highest-ranking overall.
The map below shows higher levels of vulnerability across a number of coastal communities on the East Coast, with Tendring highlighted.
Around 36% of neighbourhoods in the most vulnerable 10% for extreme heat are also in the most deprived 10% nationally. Nearly three in five are within the most deprived 20%. However, around 338 neighbourhoods in the most vulnerable 10% for heat are in the less deprived half of England.
Deprivation is closely associated with Low ability to respond or prepare, while the relationship is much weaker for Access to Cool Spaces and the Outdoor Environment.
These maps below compare neighbourhood-level patterns in the Extreme Heat Vulnerability Index with the Index of Multiple Deprivation across Greater Manchester. There is a visible overlap in many areas, with some of the neighbourhoods experiencing greater deprivation also ranking as more vulnerable to extreme heat. However, the patterns are not identical, reflecting the fact that the EHVI captures a wider set of factors beyond deprivation alone.
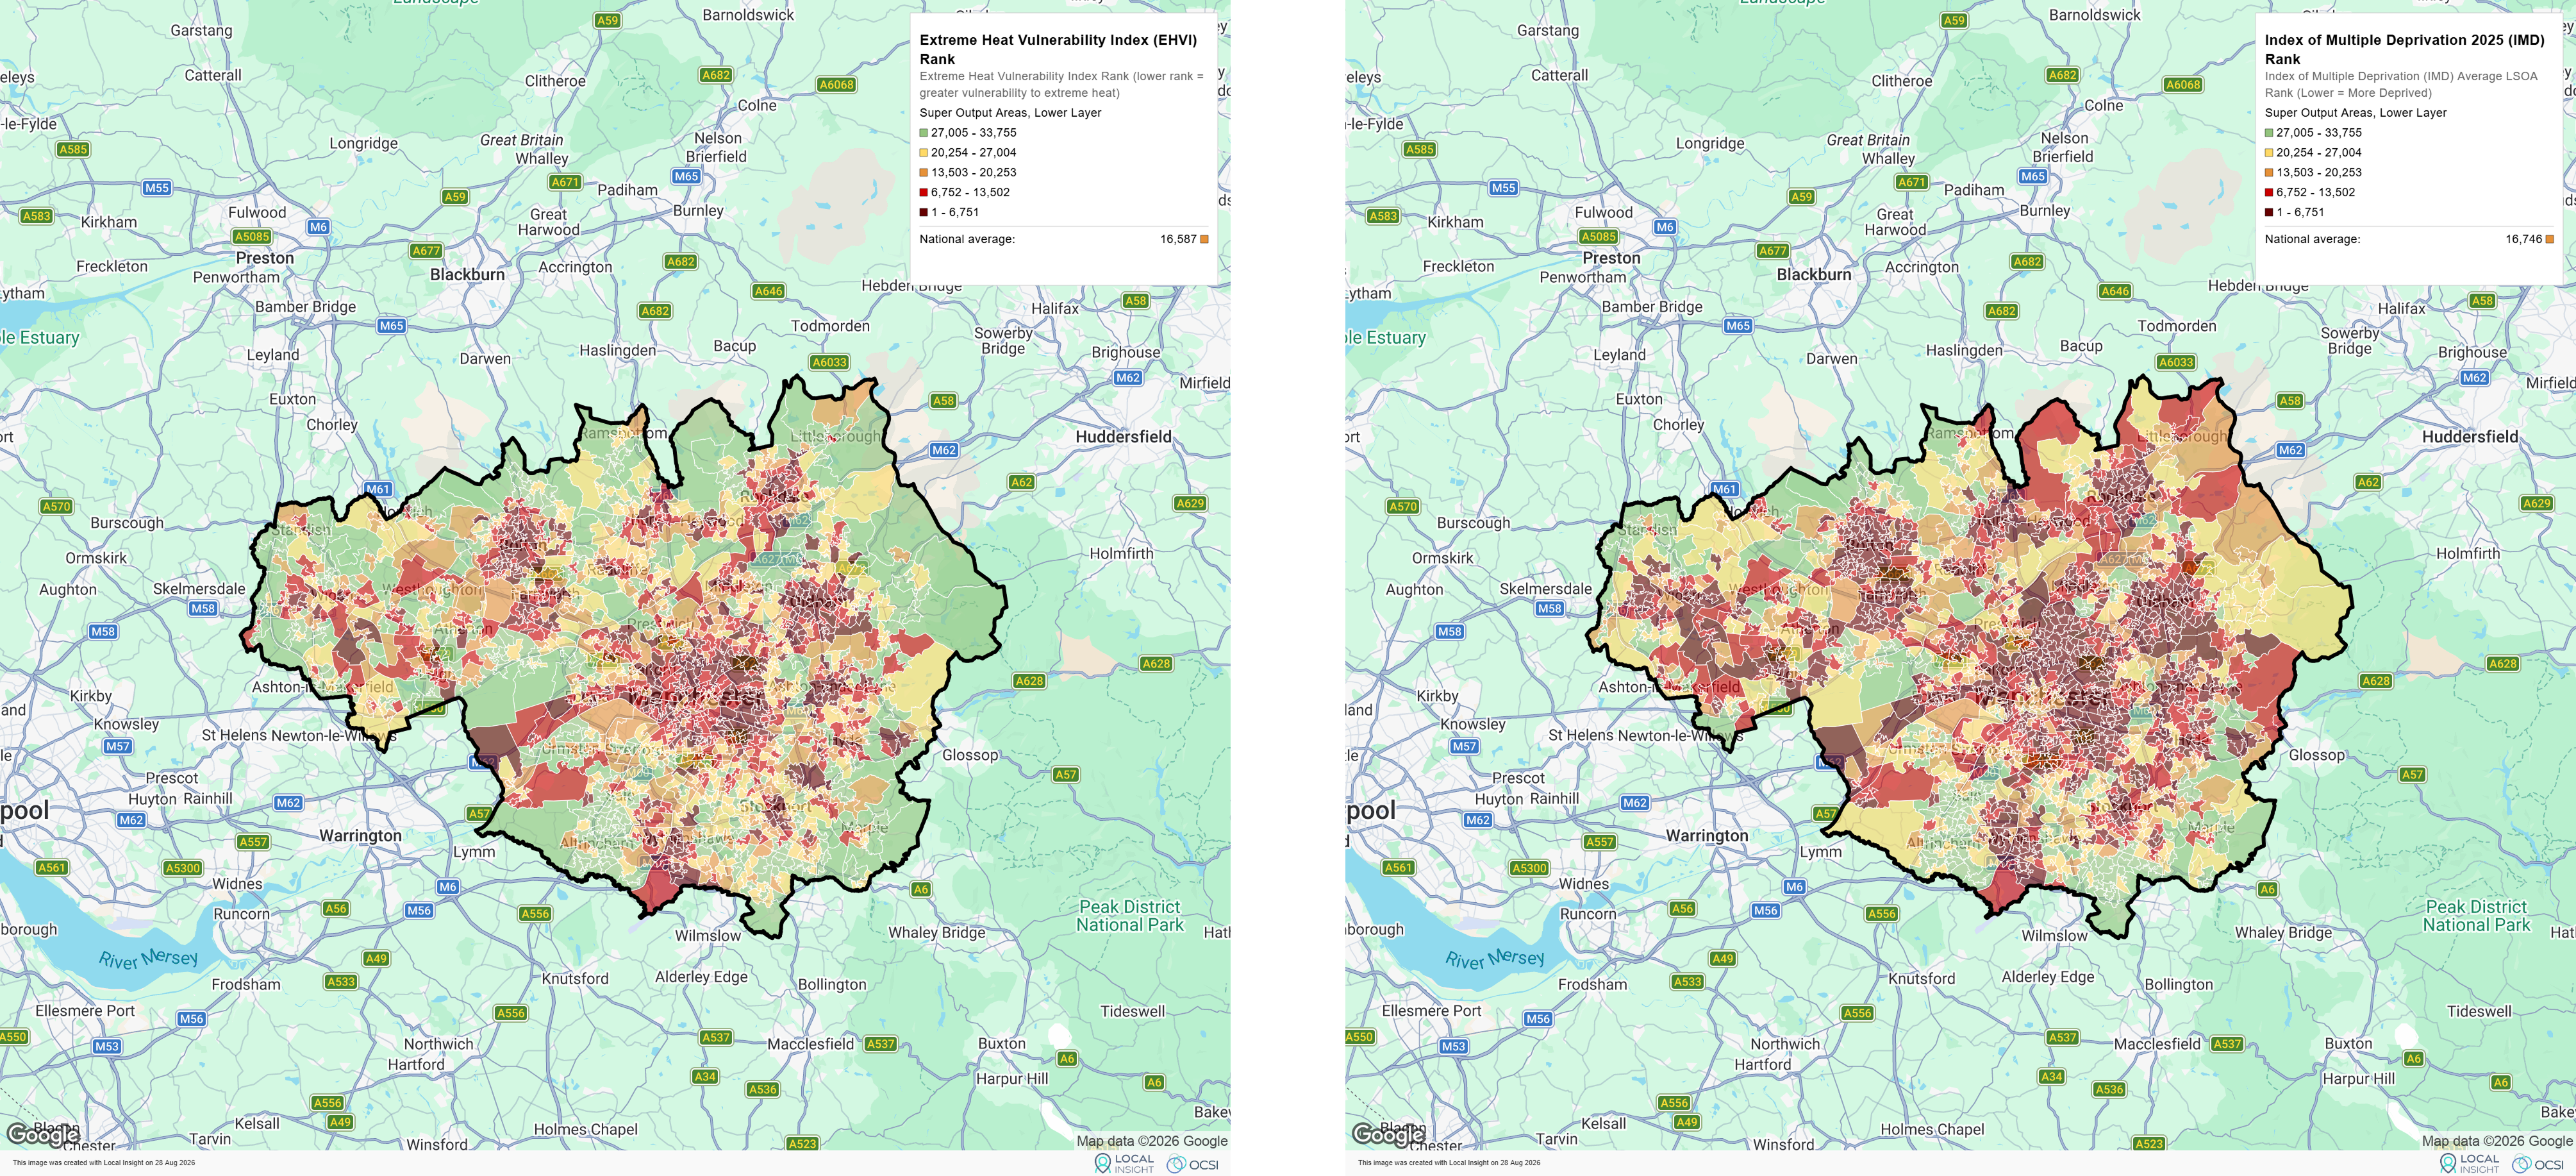
In Inner London, vulnerability is strongly associated with housing and the built environment whereas in some disadvantaged urban communities, the ability to prepare and respond is more prominent. In many coastal communities, physical susceptibility is higher, particularly because of older populations and long-term health conditions.
And at neighbourhood level, these factors often combine in different ways. The overall ranking is useful for identifying places with high levels of vulnerability. However, the domain rankings provide a more detailed picture showing what is contributing to that vulnerability and how the challenges facing one community may differ from those facing another.
Looking at the Index alongside measures such as deprivation adds another layer of context, showing where different forms of disadvantage overlap and where heat vulnerability extends beyond the patterns we might already expect.
Our accompanying methodology article explains how we developed the Extreme Heat Vulnerability Index and the indicators included within its five domains.
You can also read the full Extreme Heat Vulnerability Index report, containing the methodology and more detailed analysis.
The Extreme Heat Vulnerability Index and each of the domains is freely available to download at LSOA level.
Download the Extreme Heat Vulnerability Index
Local Insight is a place-based intelligence platform, trusted by 95+ organisations and brings together neighbourhood level data for the areas you care about, all in one place.
If you would like to explore the Extreme Heat Vulnerability Index for the places you work with alongside wider context on deprivation, health, housing and population characteristics, book a demo of Local Insight to see how you can.

Extreme heat is becoming an increasingly important challenge for communities across England,…
More
The English Community Needs Index (CNI) 2023 is now published as open…
More
Social housing providers have deep, experience-based knowledge of the communities they serve….
More