
The results of the May 2026 local elections provided plenty to reflect upon. Across the 128 English local authorities in our analysis, Reform UK won 31% of the 2,441 seats contested in May 2026 – more than any other party. Labour and the Liberal Democrats each won 16%, the Conservatives 15% and the Greens 12%. Reform also won the largest share of contested seats in 55 of those 128 councils (43%), compared to 20 for the Liberal Democrats, 16 each for Labour and the Conservatives, and 15 for the Greens.
Beneath the headline election results lies a broader geographical pattern linked to deprivation and community need. Drawing on the Index of Multiple Deprivation 2025 (IMD) and the Community Needs Index 2023 (CNI), we explore how social and economic conditions vary across places and what that might mean for England’s shifting political map.
Our analysis covers 128 English local authorities that held scheduled council elections on 7 May 2026. Two further councils held elections on the same date but are not included:
Six county councils (Norfolk, Essex, Hampshire, West Sussex, Suffolk and East Sussex) are also excluded. The majority of elections held in May 2026 were at district and unitary authority level, and we have focused our analysis on that tier to keep comparisons as like-for-like as possible. The two new Surrey shadow authorities (East Surrey and West Surrey) are excluded as deprivation data is not yet available for their newly created ward boundaries.
An important note on how we measure party performance: all figures refer to the share of seats contested in May 2026 in a given local authority rather than the overall composition of the council. Many councils only put a subset of seats up for election in any given year, meaning a party can win the most contested seats in a particular cycle while another party retains overall control from previous elections. When we say a party “won most seats” or refer to “seat share”, we mean specifically the seats contested this May rather than overall on that council.
Analysis uses 2026 local election results from Democracy Club, Index of Multiple Deprivation 2025 (MHCLG), and Community Needs Index 2023 developed by OCSI in partnership with Local Trust. Boundary data from the Office for National Statistics. All analysis is conducted at local authority district level for England only. All seat share figures refer to seats contested in the May 2026 election cycle – not overall council composition.
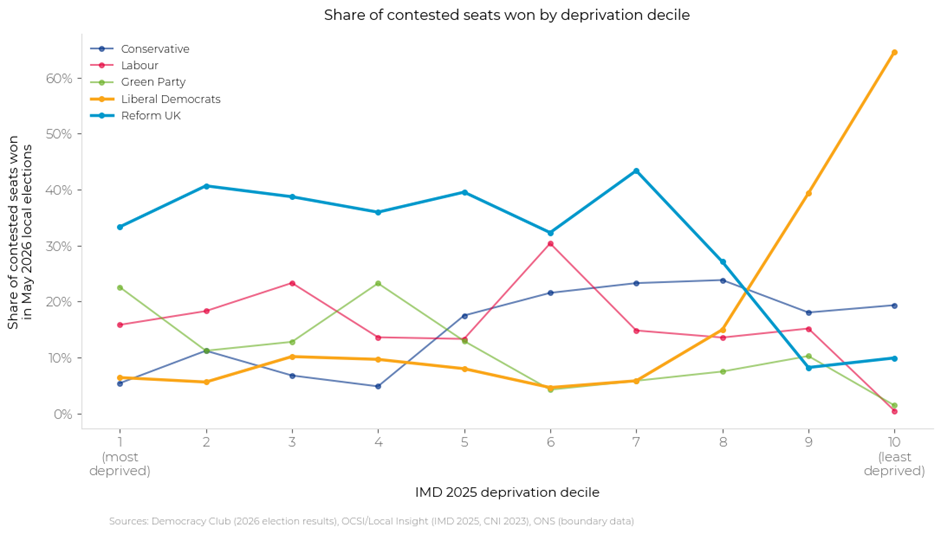
Reform won seats across all deprivation deciles, demonstrating broad success in these elections. The chart above shows the share of contested seats won by each main party across the deprivation spectrum and the patterns are striking. Reform’s performance was relatively consistent across the most deprived seven deciles, averaging around 38% of contested seats, with its highest concentration in the seventh decile at 43%. This suggests that while Reform tended to perform more strongly in relatively deprived areas, its support was spread across communities with a broad range of deprivation levels rather than concentrated solely in the most deprived places.
From decile 8 onwards, the Liberal Democrats surge while Reform declines sharply, reflecting the very different geographies in which these two parties performed strongest. By decile 10, the Liberal Democrats won 65% of contested seats compared to Reform’s 10%.
Other parties showed less pronounced relationships with deprivation. Labour and the Greens show relatively flat profiles across the more deprived half of the distribution, while the Conservatives show a gradual increase through the deciles without ever dominating anywhere – a pattern consistent with the squeeze from both Reform in more deprived areas and the Liberal Democrats in less deprived ones. The number of seats contested per council varies somewhat across deciles, but this variation is unlikely to account for the scale of the differences observed.
Overall, the relationship between deprivation and Reform’s seat share is statistically significant, though moderate in strength (r = -0.31, p < 0.001). This indicates that deprivation is associated with stronger Reform performance, but is far from the sole explanation for its electoral success as they also won substantial seat shares in areas that are not among the most deprived.
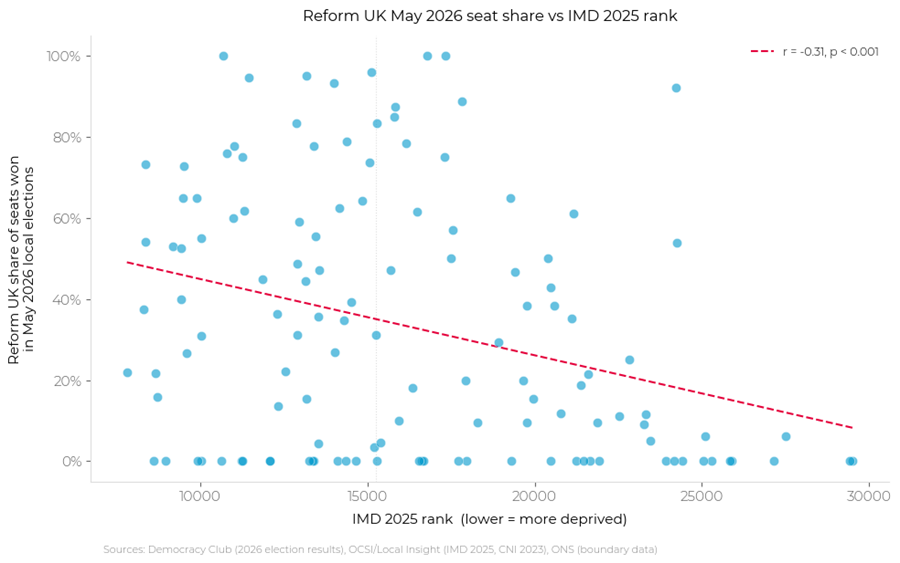
The scatter plot above illustrates this at local authority level, showing the wide spread of Reform performance across the deprivation range, which is strong in some less deprived areas, absent in some highly deprived ones, but with a clear overall trend.
Several authorities saw especially strong Reform performances. In Hartlepool, Cannock Chase and Tamworth, the party won every contested seat despite relatively substantial numbers of seats being contested in each council.
When we bring the Community Needs Index (CNI) into the analysis, the picture sharpens considerably. The correlation between CNI rank and Reform’s share of contested seats (r = -0.69, p < 0.001) is considerably stronger than the IMD relationship (r = -0.31).
The CNI measures the strength of civic assets, connectedness and active community life in an area. A low CNI rank indicates a relative absence of the social infrastructure such as community organisations, local institutions, networks of mutual support that helps places weather difficult times.
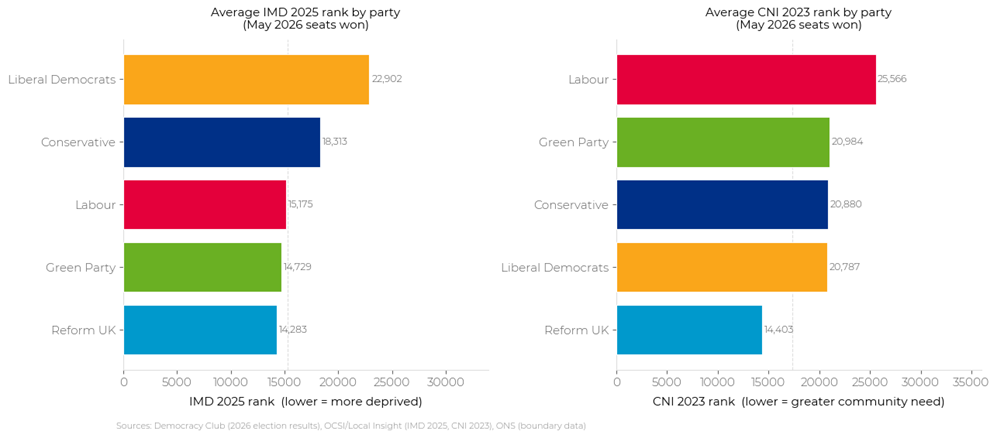
The local authorities where Reform performed best in these elections have an average CNI rank of 14,403 – the lowest of any main party. For context, areas where other parties performed best ranged from Liberal Democrats with 20,787 to Labour with 25,566.
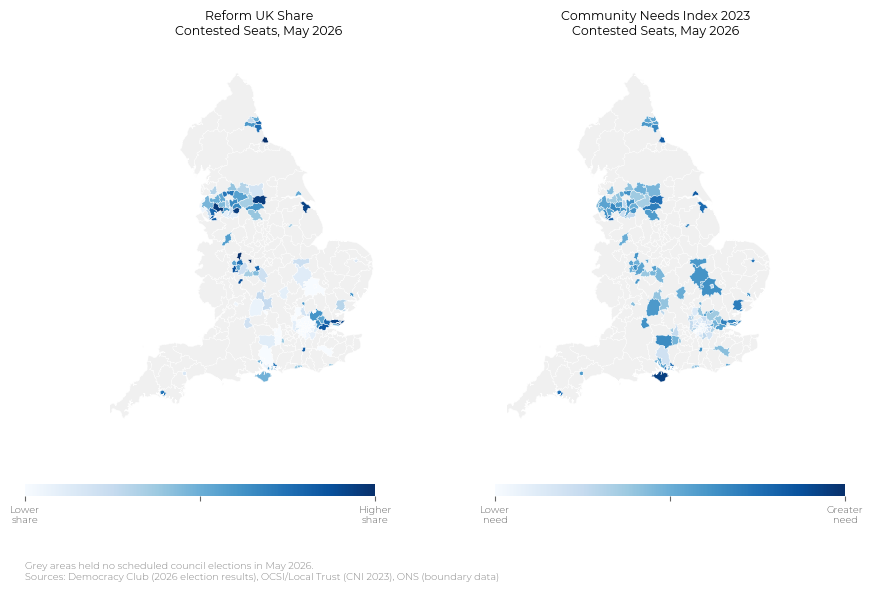
The map suggests that Reform UK’s share of contested seats in May 2026 was unevenly distributed across England, with higher concentrations visible in parts of the North East, West Midlands and North West. These patterns appear more common in areas experiencing higher levels of socioeconomic disadvantage and lower levels of community infrastructure, as measured by the Community Needs Index (CNI).
The geography indicates that Reform’s electoral presence was not solely associated with deprivation alone, but also with places where civic and social infrastructure may be comparatively limited. In a number of these areas, long-term economic change and industrial decline have altered local social and economic structures over time.
While the relationship is not uniform across all local authorities, the clustering visible on the map highlights a broad overlap between Reform’s electoral activity and areas facing multiple forms of community need.
One of the most striking findings in our analysis is the contrast between Reform UK and the Green Party. Both parties performed best in local authorities with similar average IMD ranks – 14,283 for Reform and 14,729 for the Greens. On deprivation alone, they look alike.
But their CNI profiles tell a very different story. Areas where Reform performed best average a CNI rank of 14,403, indicating high community need. Areas where the Greens performed best average 20,984, which is considerably less acute, but still indicating meaningful community need.
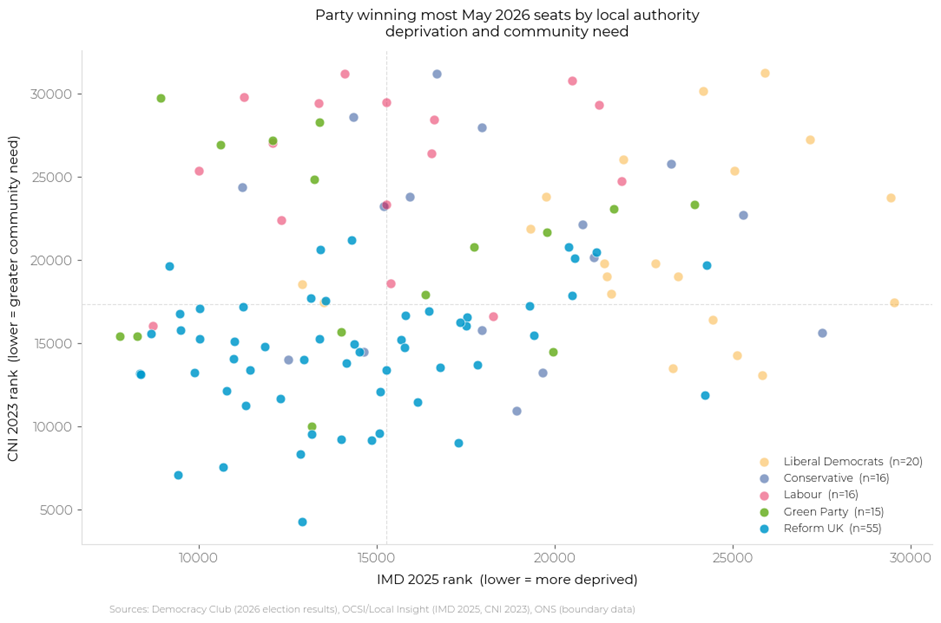
The quadrant analysis further illustrates this. Of the 55 local authorities where Reform performed best in these elections, 30 fall into the quadrant combining more deprived areas with higher community need. Often referred to as areas experiencing “double disadvantage” – these places face both economic hardship and a depletion of the social infrastructure needed to respond to it. OCSI’s own research with Local Trust has shown that these places tend to receive less funding, have lower educational attainment and worse health outcomes than similarly deprived places that have retained a stronger civic base.
The Greens tell a different story. Of the 15 local authorities where the Greens performed best, 4 fall in the more deprived/higher community need quadrant, but a further 5 sit in the more deprived/lower community need quadrant and 5 in the less deprived/lower community need quadrant – a more even spread suggesting the Greens are building a broader coalition across deprived areas rather than concentrating in doubly-disadvantaged places specifically.
Local authorities where the Greens performed best tend to have relatively stronger community assets despite economic pressures; these are urban, civically active places where community organisations, voluntary sector activity and civic participation remain relatively robust.
Reform and the Greens are both performing well in deprived neighbourhoods in England, but the data suggests they are doing so in fundamentally different kinds of places. Reform’s strongest results come in post-industrial towns where economic decline has been compounded by the erosion of community life. The Greens are making gains in areas where deprivation coexists with a stronger civic fabric, places that are struggling economically but have retained that social infrastructure and civic engagement.
Local authorities where the Liberal Democrats and Conservatives performed best in these elections sit predominantly in the less deprived, better-connected half of England. Where the Liberal Democrats performed best, the average IMD rank was 22,902 (the least deprived of any main party) and the average CNI rank was 20,788. Interestingly, this CNI profile is similar to that of the areas where the Green Party performed best (20,984), but the deprivation picture is very different. Liberal Democrat areas are considerably less deprived, suggesting that stronger community assets are a feature of both parties’ heartlands but in very different economic contexts..
Fourteen of the 20 local authorities where the Liberal Democrats performed best fall in the quadrant combining less deprivation with lower community need. These are commuter belt and market town areas where both economic conditions and community infrastructure are relatively strong.
Where the Conservatives performed best, the picture is similar, an average IMD rank of 18,313 and CNI rank of 20,880 placing them in comparably affluent, better-connected territory. However, the Conservatives appear to be losing ground at both ends, to the Liberal Democrats in less deprived areas and to Reform in more deprived ones.
Local authorities where Labour performed best sit in an interesting position. The average IMD rank of 15,175 places them in similarly deprived territory to Reform – but the average CNI of 25,566 is the highest of any main party, suggesting Labour is still performing well in urban, diverse areas where community assets remain relatively robust despite economic pressures. These are dense, multi-ethnic, civically active urban communities that have so far proved more resistant to the twin pressures of Reform’s advance from one direction and the Greens’ growing strength from another – at least in the seats contested this May.
These findings reinforce what the Community Needs Index was designed to highlight: deprivation and community need are related but distinct dimensions of disadvantage. Areas can face significant economic hardship while maintaining strong community infrastructure. And areas can face both challenges simultaneously, in ways that compound each other and leave communities with fewer resources to respond.
The 2026 results suggest a relationship between electoral performance, deprivation and levels of community need. Reform tended to perform most strongly in areas characterised by both higher deprivation and weaker community infrastructure, while the Greens performed relatively well in deprived areas with comparatively stronger community assets. These contrasting patterns indicate that deprivation alone does not explain electoral outcomes; the presence or absence of local community capacity and resilience also appears to be associated with differing voting patterns.. Whether these patterns represent longer-term political realignment or more short-term electoral dynamics remains unclear, but the findings highlight the importance of considering both socioeconomic conditions and community infrastructure in understanding recent electoral change.
For those working to understand and address inequality at a local level, these findings underline the importance of looking beyond deprivation alone. The IMD tells us where economic hardship is concentrated. The CNI tells us where the capacity to respond is weakest. Taken together, the two measures provide a more complete picture of the differing social and economic conditions shaping places across England, and help identify where pressures on communities may be most acute.

The English Community Needs Index (CNI) 2023 is now published as open…
More
Social housing providers have deep, experience-based knowledge of the communities they serve….
More
Many funding programmes use the Index of Multiple Deprivation (IMD) to identify…
More


