Housing affordability issues are affecting large parts of the population. So it’s no surprise that there is substantial interest in where the most and least affordable places to live are, for citizens and policymakers alike.
The ONS recently published some analysis on housing affordability, which uses 2016 house price data and 2013 / 2014 household income data. Inspired by ONS analysis, and the availability of more recent small area weekly income data, we have constructed a series of datasets (8 in total) around the relative affordability of buying a house in any given area. All of which are available in our Local Insight platform.
Our housing affordability indicators have been added to more than 1,100 other neighbourhood level datasets, already preloaded into Local Insight.
Local Insight provides up-to-date local level data, matched to the communities that you care about; whether that is wards, GP localities or school catchment areas.
And gives you instant access to neighbourhood level data, visualised on maps, dashboards and in reports.
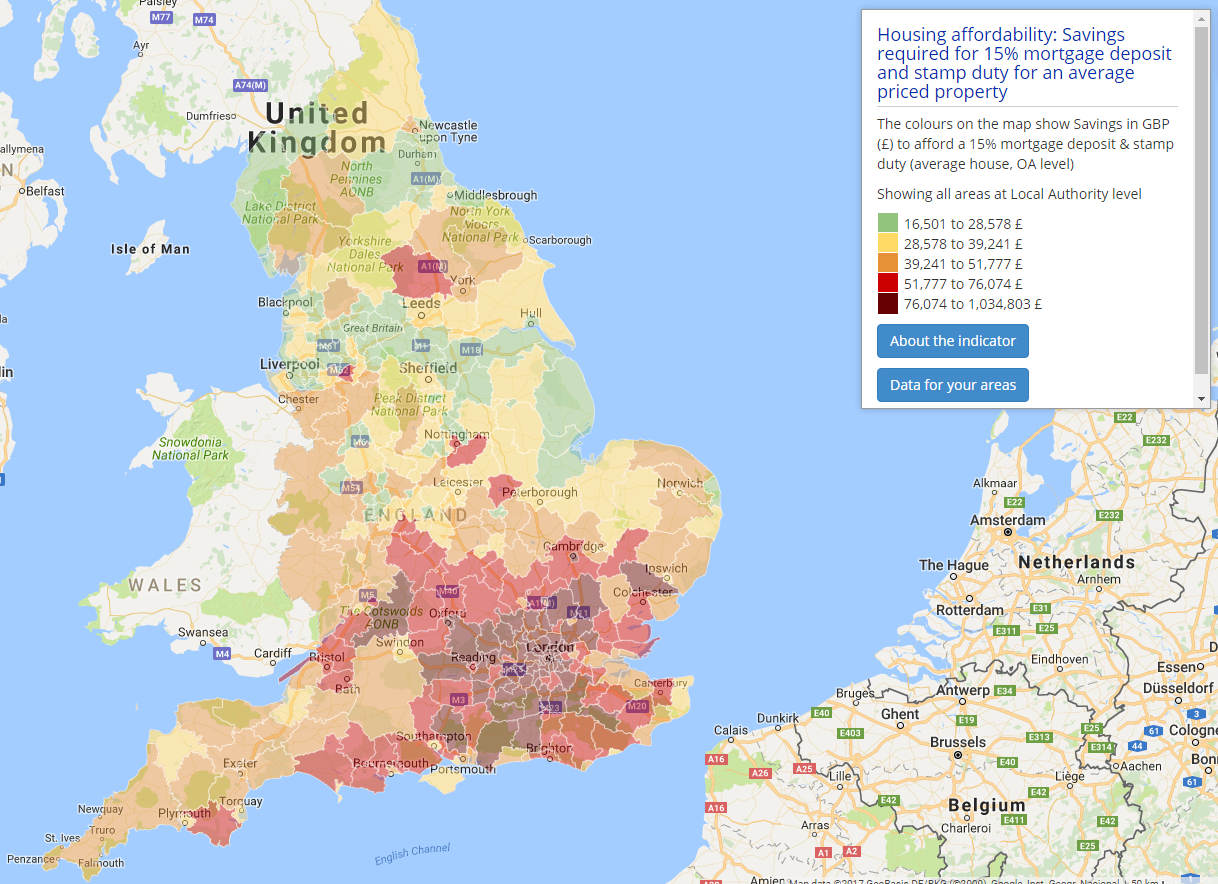
Map from Local Insight: Savings required for 15% mortgage deposit and stamp duty for an average priced property.
Explore housing affordability and more in Local Insight and
We have produced four measures around housing affordability for average house prices at output area (OA) level through combining data from Land Registry Price Paid Data from December 2015 to November 2016 with small area estimated weekly income data from the ONS.
This gives a much finer level of granularity than data directly available from ONS on housing affordability in local areas. Data at this level can give insights into local differences and housing inequalities at very small level, such as neighbouring streets for example.
However, given that these are very small areas, this data may contain some anomalies, due to the very low number of sales in some areas (which is why multiple months worth of transaction data was included). This could potentially mean that the data is more prone to being distorted by expensive pockets of housing if it contains them, and may not be representative of the local area as a whole.
We have also produced housing affordability indicators for entry level properties. These give a useful insight to the local picture for first time buyers, and can contribute to the overall picture of sustainable and good growth in a local area.
Creating these indicators using underlying OA level data for the whole country, would be very tricky as it relies upon at least 4 entry level properties being sold within each output area. Instead for these indicators, we have used MSOA level Land Registry Price Paid data as the underlying data.
For each of the indicators outlined below, we have produced datasets both for average house prices and entry level house prices (defined as house prices in the lower quartile for a particular local area) for England.
We’ll be putting another post together shortly on some of the headline stories we picked out from the data – keep your eyes peeled!
We would also love to know the local stories you find for the areas you work in. To explore this data (and a whole heap more!), sign up for a free trial of Local Insight.
Image credit: https://www.flickr.com/photos/59937401@N07/5474802142
* Statistics taken from the DCLG Housing white paper – https://www.gov.uk/government/publications/fixing-our-broken-housing-market

The Community Life Survey (CLS) is an annual survey commissioned by the…
More
We are proud to be working with Wiltshire Community Foundation to provide…
More
In Wales many areas face dual challenges, lacking accessible local assets like…
More