
This post is from Mary Silk, Researcher at OCSI.
Is third sector activity thriving in your local area? The answer may well be yes, but how would you substantiate these claims? We are seeing lots of grantmakers publishing their grantmaking data via 360Giving, which provides a lot of insight into which charities and community groups are being funded (and can be explored through Grantnav and 360Insights), however, there is still little data on third sector activity at sub-national level with national coverage.
The third sector is increasing in size, with charities reaching record numbers in nearly a decade. Understanding the levels of third sector activity can provide additional insight into local support and services. However, collecting robust data at a local level remains challenging. Our newest addition to Local Insight provides a proxy measure for third sector activity at a local level. Read on for more on this dataset, its limitations and a few headline trends.
Total registered charities is a new indicator that adds to a small data landscape for measures of third sector activity and service provision. It provides insight into the level of activity and engagement in the community from third sector organisations.
This can be used by Grantmakers and charities to inform decisions on where to work, highlight areas that may need more support from the third sector, and form part of an assessment as to whether service provision is meeting local need through comparing alongside Indices of Deprivation, for example.
The data originates from a dataset published by the Charity Commission on registered charities. The data is displayed as a rate of registered charities per 1,000 residents.
The data is based on the location of charities rather than where they operate. A charity based in an area may not necessarily reflect direct activity by that charity in that area, some of which may have a wider focus, even global.
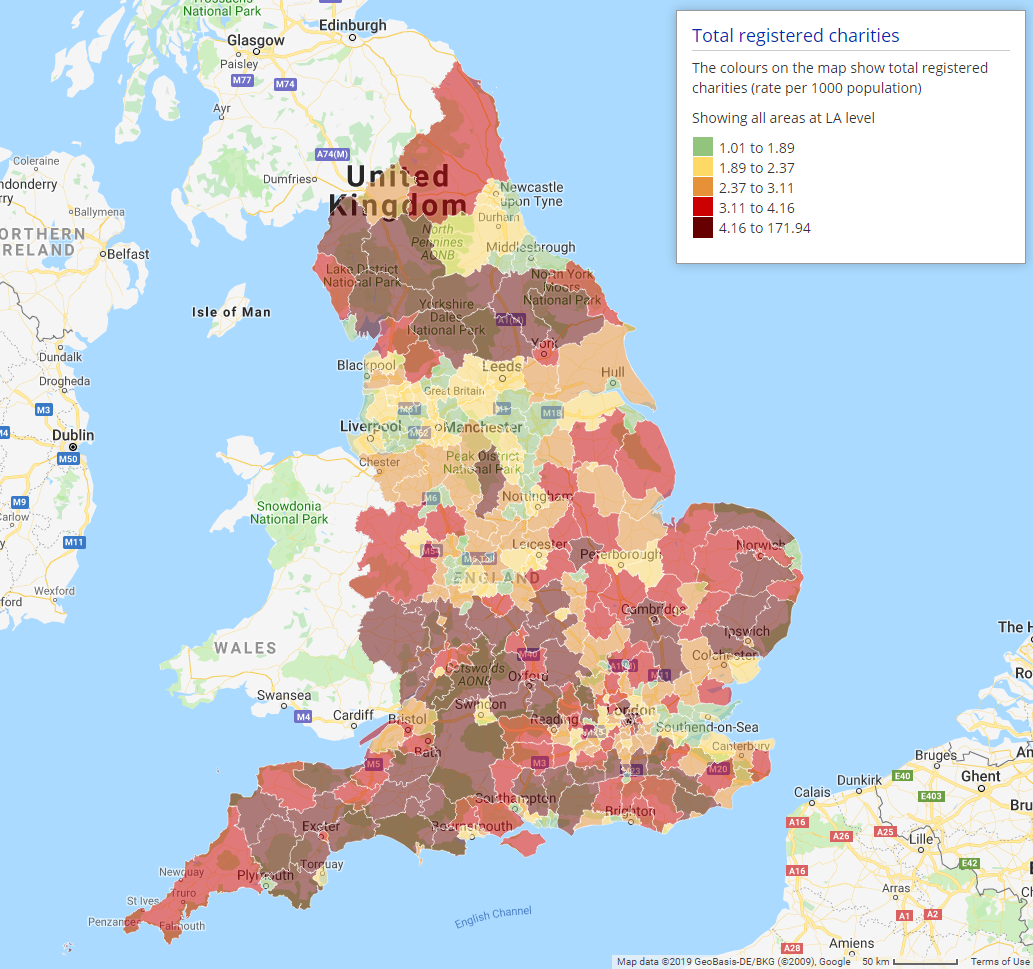
The number of charities per population varies across regions. Generally, there is a higher number of registered charities in relation to the population across the South West (3.6) and London (3.5), in contrast to much lower numbers in the North East of around 1.9 charities per 1000.
| South West | North East |
|---|---|
|
|
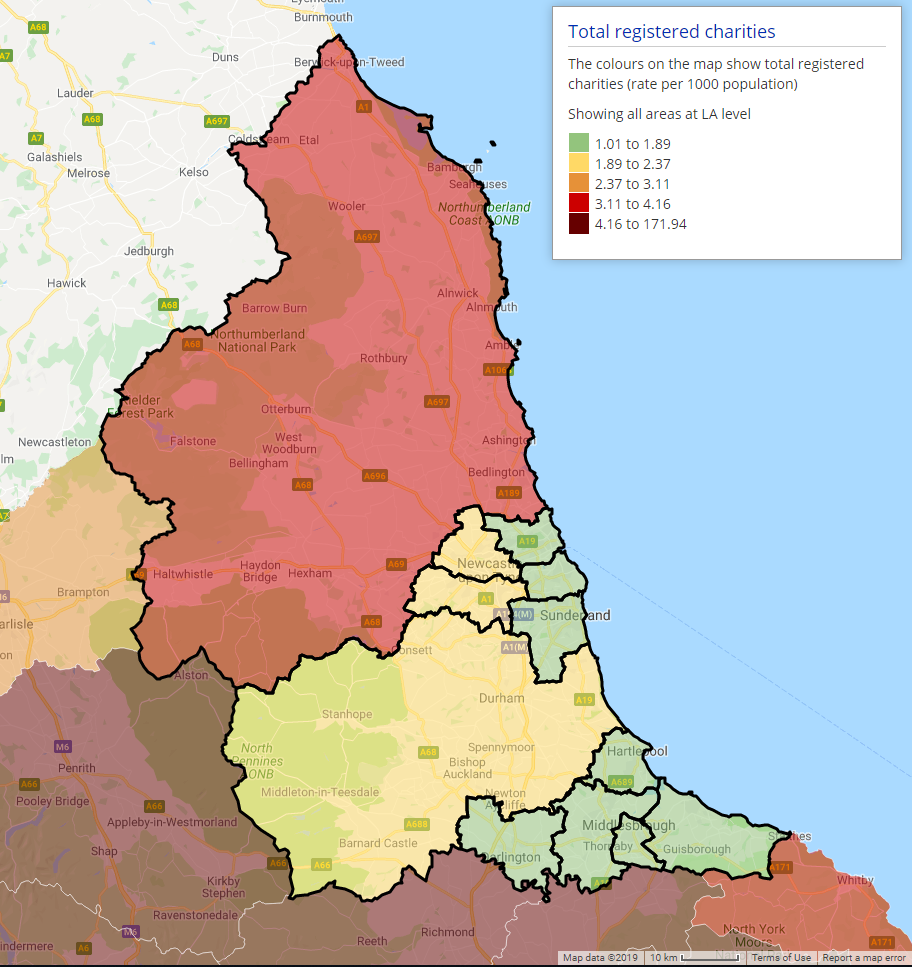 |
| The South West has the highest proportion of registered charities at 3.6, and fairly high levels are visible across the entire region. The highest concentration of charities are located in Cotswold (7.3). | The North East has the lowest proportion of registered charities (1.9). Northumberland has a relatively high proportion at 3.3, whereas the other districts have much fewer charities per 1,000 population. |
| North West | South East |
|---|---|
 |
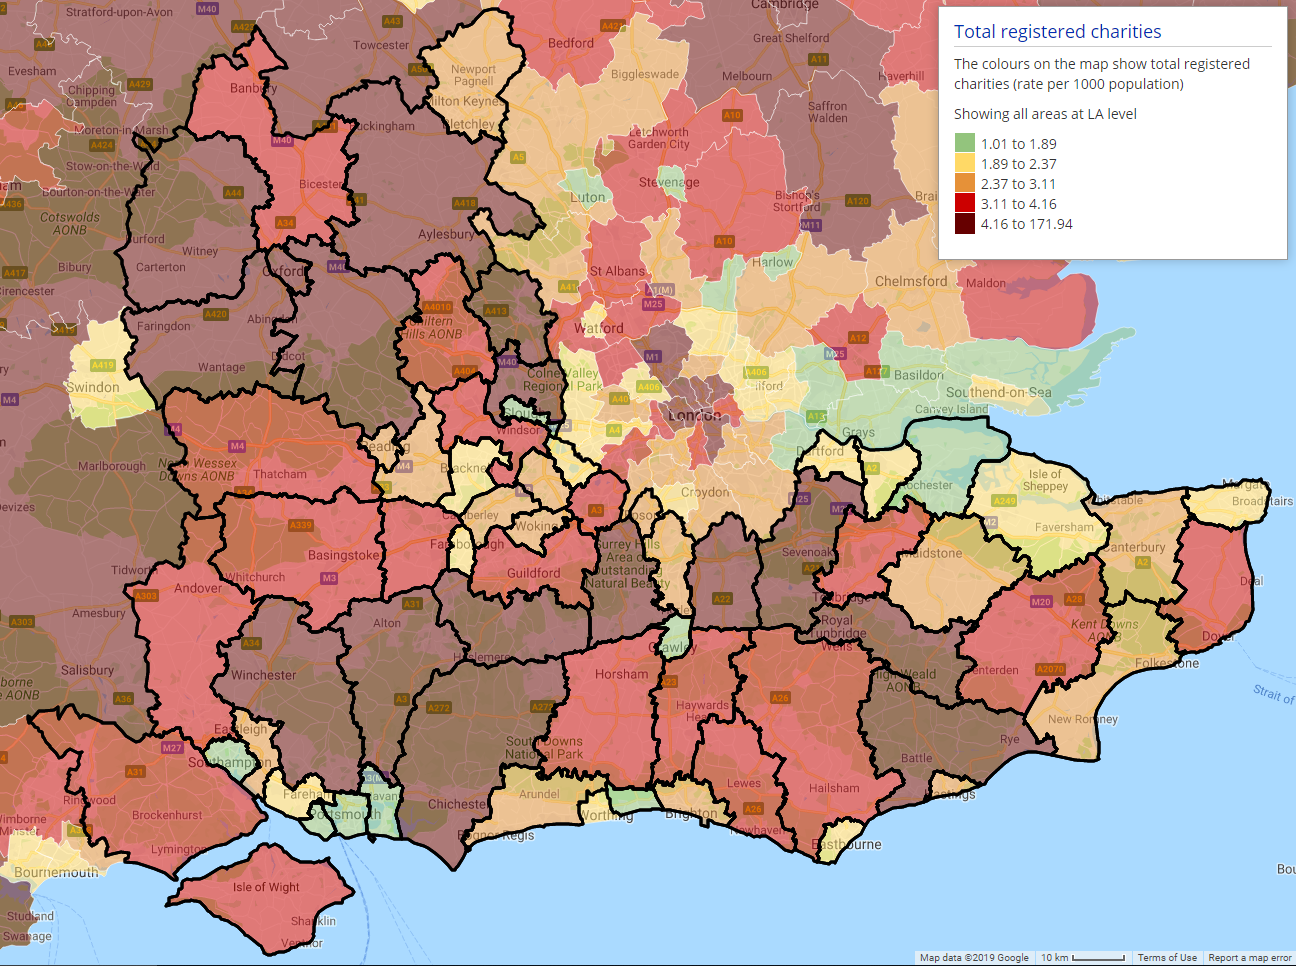 |
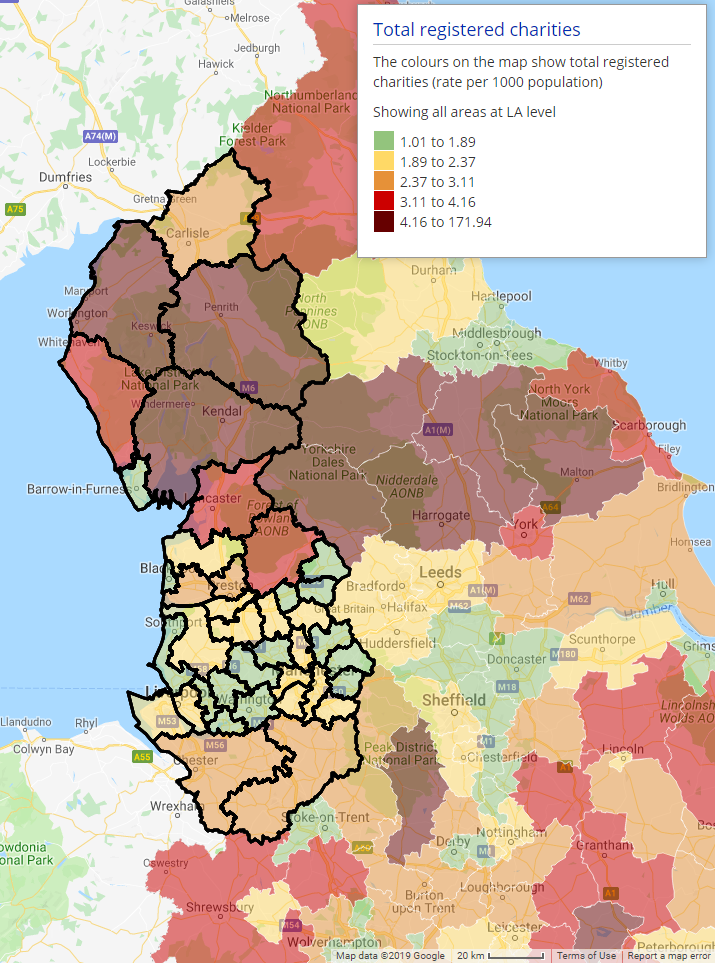
| There is a disparity in the North West. Some districts have the lowest levels of charities in the country. Blackpool is the lowest (just over 1 per 1,000 residents). In contrast, districts such as Eden (7.4) and South Lakeland (6.9) have among the highest numbers compared nationally. | The South East has a reasonably high proportion of charities (3.2). Districts within this region have fairly similar numbers, mostly concentrated in and around Hampshire and Oxfordshire. Winchester has the greatest proportion of charities of around 6 per 1,000 residents. |
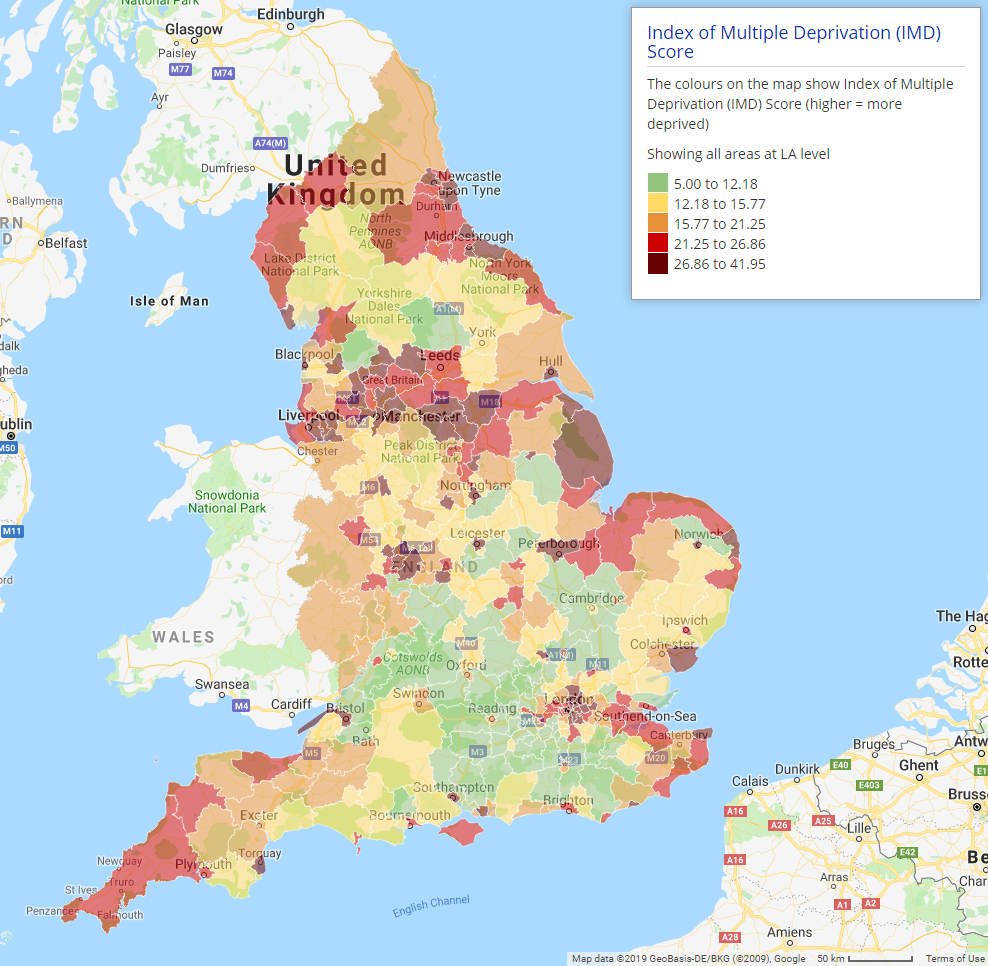
What can the indicator tell us about meeting local needs? Are levels of third sector activity indicative of inequalities in service provision? We compared numbers of registered charities with the Index of Multiple Deprivation (IMD) to see if areas with higher numbers of registered charities correspond to areas with high deprivation. Mostly, it appears they do not, with the highest proportions of registered charities falling in areas with relatively low IMD scores.
 |
 |
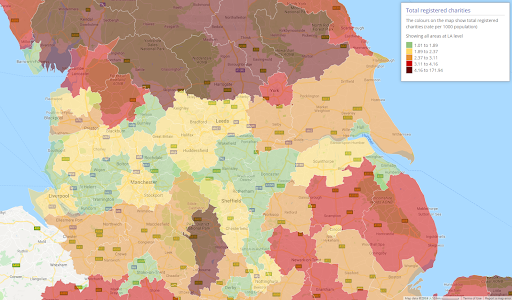
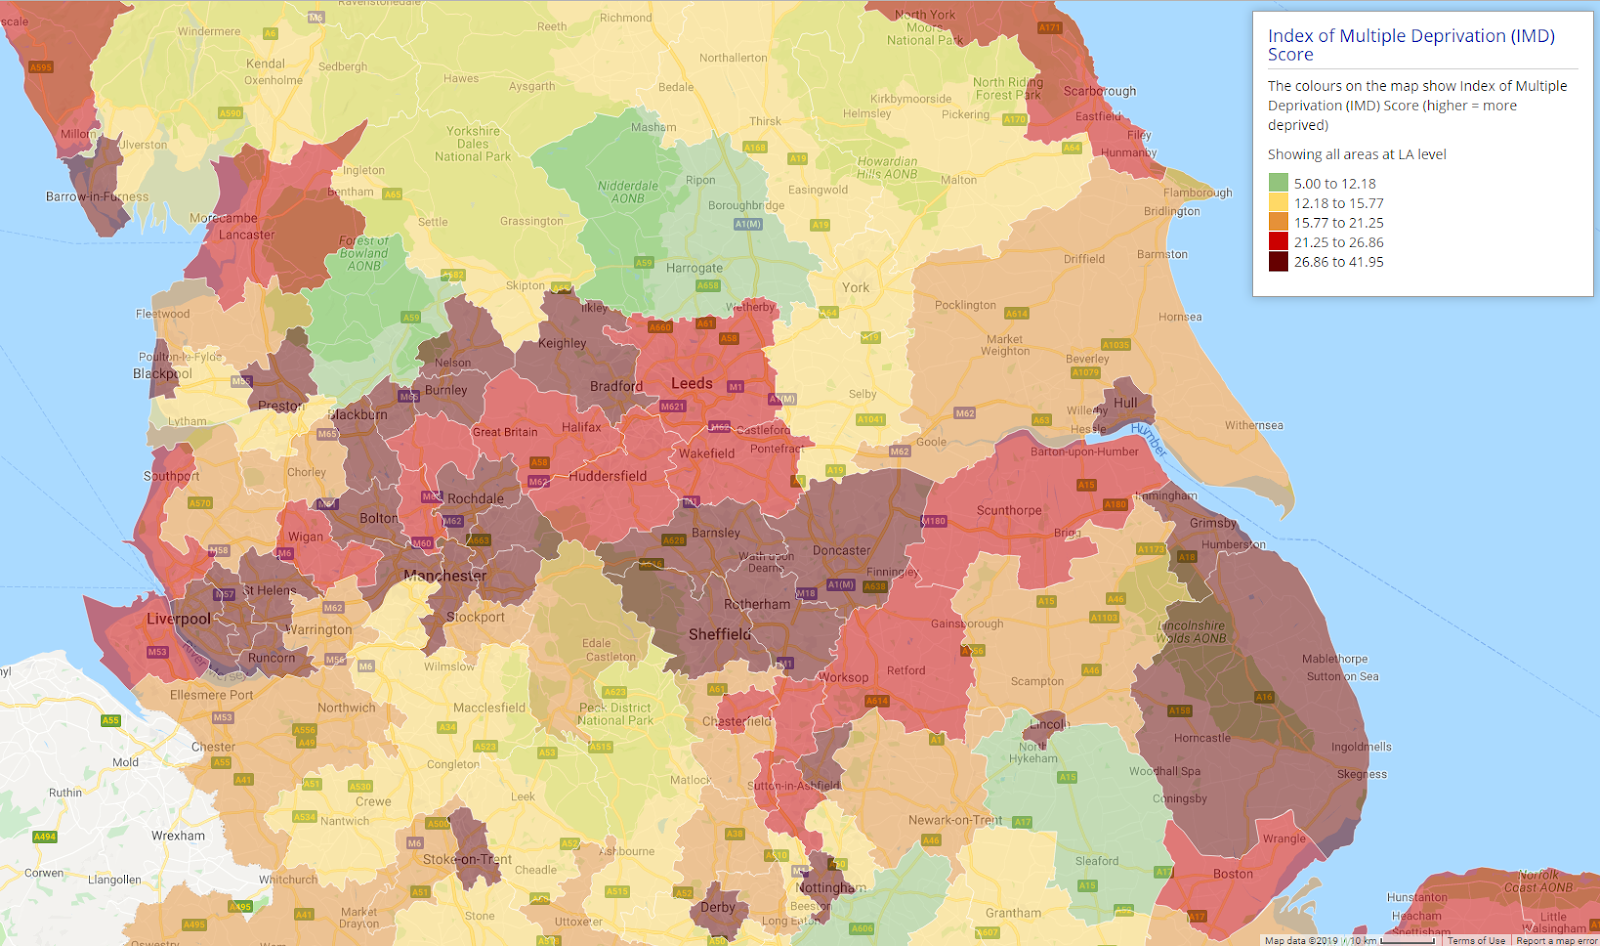
What stands out is this area of Northern England (below). Blackpool, again, which had the lowest number of charities, ranks 4th in the IMD 2015 (on the average rank measure). Similarly, the band of districts in the metropolitan counties of Merseyside, Greater Manchester and West Yorkshire have visibly lower proportions of registered charities per population yet higher levels of deprivation.
 |
 |
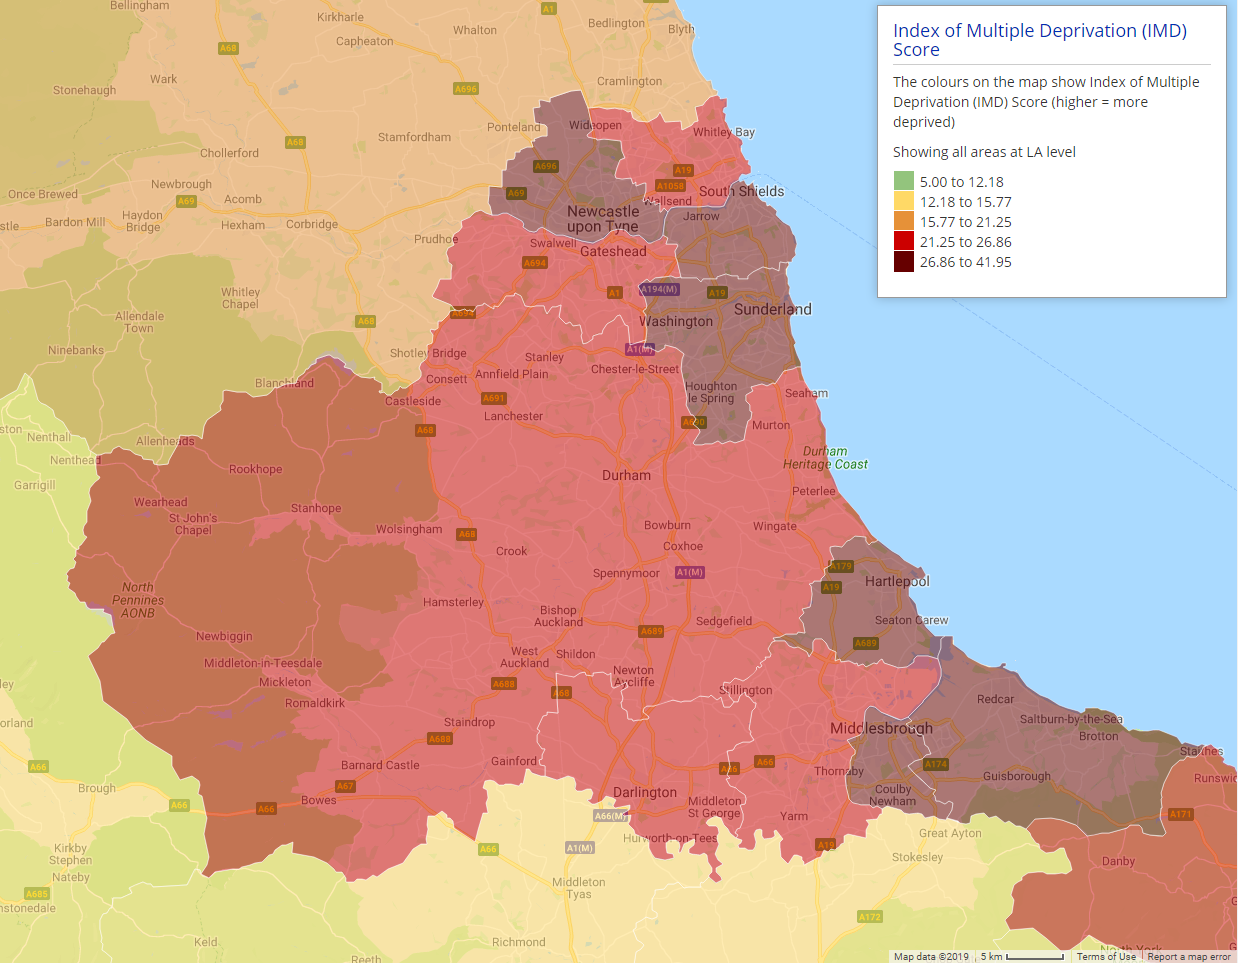
In the North East, areas with higher levels of deprivation also display lower proportions of registered charities. Middlesbrough has a small proportion of charities of 1.4 and ranks 16th in the IMD.
 |
 |
This suggests that some of the areas with the highest levels of deprivation also have relatively low levels of third sector activity to mitigate and address some of the needs and challenges they are experiencing. This gap between charity provision and need seems particularly large in the North of England.
It is important to be aware of the limitations of the dataset which shows where a charity is registered rather than where it operates – with some evidence of a concentration of larger charities in economically buoyant cities where there are large networks of other service based organisations and a highly skilled workforce – for example the highest concentrations of charities can be seen in central London (171 per 1,000 in the City of London and 12.5 per 1,000 in Westminster).
However, the majority of charities are smaller (79% have an annual turnover of less than £100,000) and the absence of these smaller charities in economically peripheral areas that are experiencing multiple challenges suggests a possible gap in service provision to address some of the challenges in these areas.
One of the benefits of this indicator is you can drill down to see third sector activity at small area level, which may be able to highlight particular hubs for third sector activity. However, as mentioned in the limitations, a charity based in a neighbourhood may not necessarily reflect activity specific to that neighbourhood.

The map shows how charities are distributed within London. Unsurprisingly, there are high concentrations in central London, but the map also shows clusters in other affluent parts of the city including Highgate and Hampstead, Richmond and Wimbledon.
If you want to know more, request a free trial of Local Insight to:
We’d love your feedback on the dataset itself including any ideas for improvement and potential use cases. Let us know on support@ocsi.co.uk

The English Community Needs Index (CNI) 2023 is now published as open…
More
Social housing providers have deep, experience-based knowledge of the communities they serve….
More
Many funding programmes use the Index of Multiple Deprivation (IMD) to identify…
More


