
The RSA has published an excellent analysis piece, which has revealed that in some Local Authorities more than one-in-three jobs are at risk due to COVID-19. We have extended this analysis to look at jobs at risk data at a more granular level in order to estimate the extent of risk across local labour markets within Local Authorities as well as identifying the neighbourhoods with the highest concentrations of people who have been furloughed.
The data may be of particular interest to those working on economic and regeneration strategies as part of an evidence base to highlight where investment may be needed to diversify the economy, encourage start-ups and support vulnerable businesses.
Our initial analysis below focuses on the towns with the highest proportions of jobs at risk, and the MSOAs where the highest proportions of workers are furloughed.
You can access the two indicators on which the analysis is based through Local Insight, our mapping and reporting platform with more than 1000 local level datasets for the areas you care about (whether that is towns, wards, constituencies or parishes)
We have used furloughing data for each major industry sector (released last Thursday) and matched these against the jobs profile for each LSOA, MSOA and Local Authority in Britain to identify hotspot areas where the jobs market is likely to be most at risk (see more detailed methodology below).
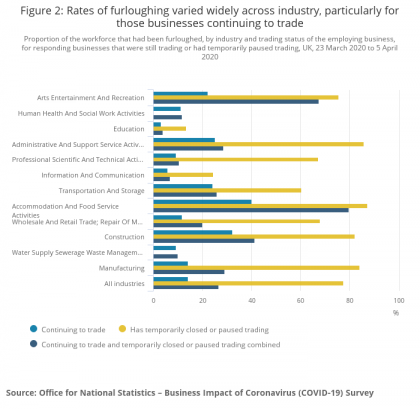
The chart above shows the sectors that are most at risk, with more than two-thirds of jobs in accommodation and food services and arts entertainment and recreation currently furloughed.
The map below shows the proportion of jobs at risk data by Local Authority across England.
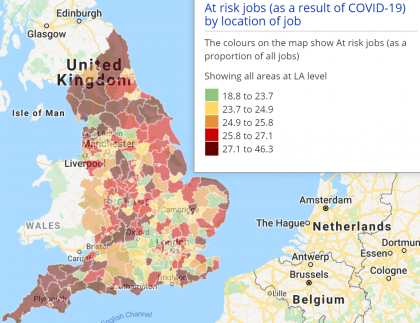
As you can see, the highest concentrations are seen in coastal and large rural Local Authorities containing resorts and national parks where the hospitality industry predominates. The lowest concentrations are found in and around London and University towns with a stronger knowledge economy.
Drilling down further to town level, we can see that in some towns more than 40% of jobs are at risk. The 10 towns with the highest proportion of jobs at risk are shown in the table below. Each of these are located in areas with high dependence on tourism, with eight of the 10 located in seaside resorts.
| Town | Local authority | Number of jobs at risk | % of jobs at risk |
| Hemsby | Great Yarmouth | 483 | 46.6 |
| Dartmouth | South Hams | 1,064 | 46.0 |
| Windermere | South Lakeland | 1,855 | 44.8 |
| Newquay | Cornwall | 3,421 | 44.1 |
| Looe | Cornwall | 6,94 | 43.7 |
| St Ives | Cornwall | 2,028 | 43.6 |
| Skegness | East Lindsey | 4,693 | 43.4 |
| Rye | Rother | 756 | 42.0 |
| Mablethorpe | East Lindsey | 1,097 | 41.6 |
In order to get a fuller understanding of where pressures on the labour market are likely to be most acute, it is important to consider not just the location of ‘at-risk’ jobs but also the location of employees, whose jobs are at risk. This is because people commute outside of their areas of residence to work and some vulnerable local labour markets are more closely connected to stronger neighbouring labour markets, while others are more isolated.
We have combined ONS furloughing data by industry sector and census data on employment by industry sector for England and Wales in order to get an understanding of at-risk jobs by place of residence. This provides insight into which neighbourhoods are at greatest risk of rising unemployment.
The table below shows the MSOAs in England with the highest proportion of people who are furloughed – again, these are predominantly concentrated in coastal areas.
| MSOA | Local Authority | No. of ‘at risk’ employees | % of employees ‘at risk’ | IMD quintile (5 is most deprived) |
| South Promenade & Seasiders Way | Blackpool | 1,130 | 47.1 | 5 |
| Windermere North, Ambleside & Langdales | South Lakeland | 1,427 | 45.5 | 2 |
| Central Blackpool | Blackpool | 1,154 | 44.3 | 5 |
| Ingoldmells & Chapel St Leonards | East Lindsey | 1,009 | 44.2 | 5 |
| North Shore | Blackpool | 1,034 | 42.4 | 5 |
| Keswick & Derwent Valley | Allerdale | 1,294 | 41.1 | 2 |
| Minehead Outer & Porlock | West Somerset | 1,096 | 40.7 | 3 |
| Isles of Scilly | Isles of Scilly | 444 | 40.2 | 2 |
| Torquay Central | Torbay | 1,206 | 39.9 | 5 |
| Padstow & St Issey | Cornwall | 1,027 | 39.5 | 3 |
Five of the 10 areas with the highest proportion of employees ‘at-risk’ are already located in areas which have high overall levels of deprivation (ranked among the most deprived 20% of areas), suggesting that COVID-19 may exacerbate the deprivation challenges in these areas.
_________________________________________________________________________________
The ONS Business Impact of Coronavirus Survey (BICS) includes data on the furloughing of workers across UK businesses between March 23 to April 5, 2020. This data includes responses from businesses that were either still trading or had temporarily paused trading. The figures are summarised in this table.
This data has been mapped against the industrial composition of jobs for LSOAs, MSOAs and Local Authorities to estimate exposure to labour market risks associated with COVID-19. Information on local jobs by industry is taken from the Business Register and Employment Survey (BRES) 2018 open access data – with breakdowns by Industry Sections (which match against the ONS Industrial classifications).
This approach calculates the total number of jobs at risk in each local area by identifying the number of jobs in each industry in that area multiplied by the estimated percentage of those that have been furloughed on the Government’s Coronavirus Job Retention Scheme (CJRS) (taking the combined figure for businesses who are continuing to trade and those who have paused or ceased training. These are divided by the total number of jobs in each local area to calculate the percentage of jobs at risk.
Note, employees in industry sectors which were not recorded in the ONS Business Impact of Coronavirus Survey (BICS) due to inadequate sample size have not been included in the numerator or denominator for this dataset – these include Agriculture, forestry and fishing, Mining and quarrying, Electricity, gas, steam and air conditioning supply, Financial and insurance activities, Real estate activities. Public administration and defence; compulsory social security and activities of households as employers; undifferentiated goods – and services-producing activities of households for own use.
The method for identifying employee jobs followed the same approach, but the data used to identify local employees at risk was based on the 2011 Census industry of employment tables (KS605 and QS605) which identify employees by sector by place of residence (where they live rather than where they work). While this data is out of date, it represents the only robust data on employees by industry sector and place of residence at sub-regional level. The ONS BICS data on the furloughing of workers by sector is matched against the 2011 Census employee data to produce a count of ‘at-risk’ employees. A denominator – the total number of employees resident in the area is used to create the proportion of ‘at-risk’ employees. Again – industries not included in the ONS figures are excluded from both the numerator and the denominator.

The English Community Needs Index (CNI) 2023 is now published as open…
More
Social housing providers have deep, experience-based knowledge of the communities they serve….
More
Many funding programmes use the Index of Multiple Deprivation (IMD) to identify…
More


