
Census 2021 is complete – so now the real work starts.
We have had lots of people asking us when they can expect to see the census data. This year the current line from the ONS is that they aim to produce the first release outputs from the census findings in late spring 2022, which, despite the almost year’s wait, is faster than the previous census. The full data release is currently planned for March 2023.
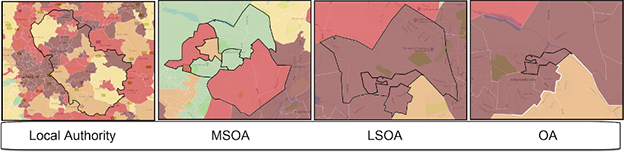
The first release is likely to be just the total population at Local Authority level. This will then be followed by key statistics tables that cover data on the major themes of the census: ethnicity, qualifications, economic activity, general health and so on.
Once that Local Authority data has been released, we can expect to start to see some of the small area data outputs – LSOA and MSOA.
The final release is scheduled for March 2023. This is likely to include cross tabular datasets data that cuts across different themes, such to allow a study of relationships across two different types of datasets. For example, you may be able look at age and homeownership or ethnicity and health.
Included too in this final release will be origin and destination data – an examination of travel to work patterns and migration patterns.
You can track progress of the timetable set out by the ONS here.
Our intention is to have all key statistical tables live in Local Insight within one week of being published by the ONS.
New Developments
The ONS is planning to develop a dissemination tool, which will allow users to create bespoke tables that cut across different sensor table themes. This will allow users to ask bespoke questions of the census, pertinent to their exact needs and combinations of data required, resulting in bespoke data tables for analysis. This is an exciting development and we can’t wait to see the final product and work out how to get this into Local Insight.
New Geographies
Changes in Output Area geography
As part of the Census 2021 update, the ONS are planning to make some changes to the Output Area geographies, with potentially up to 5% of all Output Area boundaries changing. This will have knock on effects for the LSOA and MSOA boundaries, as all areas will continue to nestle within larger boundaries. This is critical to Local Insight as Output Area boundaries are the building blocks for all the custom areas created by our users within the tool.
There are three main circumstances where a change in OA boundaries may occur –
Firstly, where the population has changed dramatically – a defining principle for OAs is that they are comparable in size and composition.
Secondly, to align Output Area boundaries more closely with the latest ward and parish boundaries to facilitate better data at these levels – so that fewer wards and parishes are based on ‘best-fit’ geographies.
And finally, where OAs are split by Local Authority boundary changes that have occurred since the 2011 Census, ensuring that they are aligned to the changed Local Authority boundaries as of 2022.
It’s worth considering one of the driving motivations for the changes in boundaries this time around which is the wider context of the 2021 Census – the fact that is has been conducted during a pandemic.
This may result in unexpected changes in population as many people are not currently residing within what may have been a normal place of residence. For example, it’s estimated that a large number of people that are normally resident within the UK are currently living abroad, particularly foreign students and migrant workers, meaning we may see more changes in population patterns than were observed in the last census. We are yet to hear any planning considerations from the ONS in terms of how they may want to account for some of these non-typical changes in population.
Impact on Local Insight functionality
In order to ensure that we are ready to load census data into Local Insight and to ensure that all of the data in the system is based on the most up to date and relevant geographies, we propose to update Local Insight to run on Census 2021 OA/LSOA and MSOA geographies in advance of when the data for the Census 2021 is released at this geographical level (this is of course contingent on the geographic definitions for these new OAs being released comfortably in advance of the data).
As part of this process, we will need to convert all custom areas built from component areas that have changed, so that they will be based on the new OA/LSOA/MSOA building blocks.
We will also need to ensure that we can continue to read in data for both new and old geographies – to support both our users who hold their own data for old geographies, as well as for any data suppliers who are still publishing their data for old geographical boundaries. Our experience from last time was that a number of data suppliers were slow to change to the new geographies, with some still publishing data at old 2001 geographies as recently as 2019! Where data is published for old geographies, we will convert it to the new geographies on the site.
Moving to the new Output Area boundaries will have some implications for users. Those custom areas which contain OAs, LSOAs or MSOAs that change in 2021 will be updated to reflect these changes – what this means is that users may see some very slight changes to the data for some of their custom areas.
Also, for those areas created by standard area, users may see some changes to the way the boundaries on the map are displayed. Where change occurs, we will make sure that we notify any affected users of their custom area changes.
There will also be some minor changes to the thematic maps, with small, (largely imperceptible), changes to MSOA and LSOA boundaries. Because the number of areas will change, there may be a small number of areas which will see a change in quintile rank where they were previously ranked on the margin of two quintile bands. However, it is important to emphasise that this will be a small change that will only affect a handful of areas.
As mentioned above, we will need to convert all older data to the new geographies and all new data published for old geographies, to align with the new boundaries, so there will be some small differences from the published data for data released for the old boundaries.
Lastly, any custom datasets users have uploaded may display differently and therefore may require re-uploading.
We will send each Local Insight Group Admin a breakdown of the custom datasets affected and guidance for how to re-upload successfully.
It is also worth emphasising that we do not intend to implement any of these changes until close to when the small area Census data is ready to load in. In reality this means the latter part of 2022 at the earliest.
Data Changes
It is of course not only the geographies that will be updated as part of Census 2021, the new census will also bring updates to much of the data within Local Insight. This will see our largest single update to data we have ever managed as we expect to update up to 356 census indicators on the site.
In addition to this, the new census population figures will have knock on effects for the Mid Year population Estimates. As in 2011, the Mid Year Estimates will be revised to ensure they are aligned with the population base as counted in Census 2021 – this re-alignment will also affect the historical population estimates between Census 2011 and Census 2021. This will affect not only the population indicators themselves, but also any indicator which used population estimates as a denominator – with at least 275 indicators potentially affected – this number is likely to increase by the time the census data is released.
New Data Opportunities and Discussions
As well as updates to existing indicators, there are likely to be new sources of interesting data coming out from the census.

For example, there are new questions relating to sexual orientation and gender identity which will enable analysis of the size and socio-demographic characteristics of the LGBTQI+ communities in different local neighbourhoods.
ONS are also planning to develop a new flexible dissemination system for creating tables. This should make it easier to create bespoke tables which cut across multiple census themes; for example, identifying areas with high concentrations of young adults, with both low skills and high unemployment.
Another benefit of the new dissemination tool is that the cross tabular data will be made available much earlier than it was last time around, when cross theme tables were some of the last outputs to be released. In order to get the most from this data, we plan to engage with users closer to the time of release as to what sort of cross theme data users would like to see in Local Insight.

Another potentially exciting development is the possibility of linking census data with key administrative data at record level to produce multi-variate small area measures of interest. Based on the noises coming from the ONS consultation events so far, we are led to believe that they are having interesting discussions with the Valuation Office Agency about producing a more sophisticated overcrowding measure that takes into account room size. They are also in discussion with HMRC and DWP about producing a robust small area household and personal income measure (which would be very useful indeed!).
If this all sounds like it could help you and your organisation, get in touch for a demo and free trial.

The English Community Needs Index (CNI) 2023 is now published as open…
More
Social housing providers have deep, experience-based knowledge of the communities they serve….
More
Many funding programmes use the Index of Multiple Deprivation (IMD) to identify…
More


