
The recent energy price hikes alongside rising housing and food costs have all contributed to increased vulnerability to a cost of living crisis for many households across the country. While most of us are feeling the squeeze in some way, for many, it is leading to stark choices between food, heat and other necessities.
We combined pre-existing open data to produce an experimental, small-area “Cost of Living: Vulnerable households” indicator. This measure combines data from Joseph Rowntree Foundation (JRF) on a Minimum Income Standard with the most comprehensive data available on household incomes to produce a relative measure – where a higher score indicates higher vulnerability to cost of living crisis.
While Local Authority level data on cost of living exists, this measure brings something new to the data landscape, as it is small-area level and captures a broader set of income groups (incorporating income data from employment, self employment, tax credits, benefits and pensions). This is an experimental measure and we will explore what this can and can’t be used for below, alongside some analysis of the most vulnerable areas.
The data is currently available in our Local Insight tool.
We are keen to hear any feedback and suggestions for how we can improve this measure, as well as any additional resources we should be aware of.
We used JRF’s research on a Minimum Income Standard (MIS) to define an income level required for people to have an acceptable standard of living. This research is the widely accepted definition used for things like defining the Living Wage.
We then upweighted the data for inflation (using the Consumer Prices Index including owner occupiers’ housing costs (CPIH) inflation figure between April 2021 and March 2022), and made adjustments for each local area based upon household characteristics (as the thresholds differ for single occupancy households, depending on whether they are pensioner or younger one-person households).
We used the Office for National Statistics admin-based income estimates of net equivalised household income as the household income measure. This is the most robust and comprehensive data on household incomes and covers PAYE earnings, self employment, pensions, and benefits income. However, the dataset is now quite old (published in 2016), so we have upweighted to accommodate for median national wage levels rises since then.
This dataset shows the equivalised income level threshold across each decile in an LSOA. A decile splits the population (by households) into 10 equal parts e.g if there were 1,000 households in an LSOA, the bottom decile is the 100 households with the lowest income, the 2nd decile is the 100 households in the next 10-20% of household income, the top decile is the 100 households with the top 10% of household income.
The score shows the number of decile thresholds that fall below the adjusted Minimum Income Standard (MIS). A higher score indicates that a greater number of deciles fall below the MIS i.e. an area has a higher proportion of households falling below the MIS.
For more information, please see our methodology paper.
As this measure is experimental in nature, we must note and understand the limits of what you can and can’t use it for.
You can use this measure to:
You can’t use this measure to:
We made a number of assumptions due to the limitations of available data at small area level.
The map below shows the Local Authorities with the highest level of vulnerability on the “Cost of Living: Vulnerable households” indicator. Brown areas have a relatively high proportion of vulnerable households, while green areas have relatively low levels of vulnerable households.
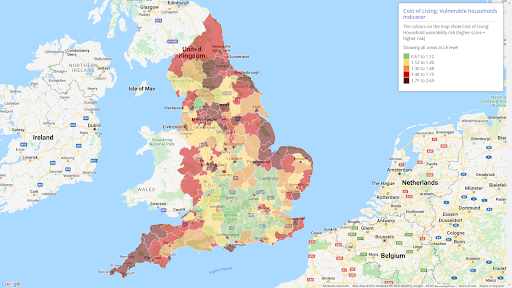
Map taken from Local Insight
The highest concentrations of vulnerable households are in:
Unsurprisingly, there is a strong association between vulnerability to cost of living crisis and high benefit claimant rates, with many of the areas with the highest proportion of people in receipt of DWP benefits (including Universal Credit) also ranked among the areas with the greatest household vulnerability.
However, there are a small number of areas identified as having higher vulnerability than would be expected given overall levels of benefit dependency. These include many of the smaller seaside resorts around Devon, Cornwall and the Isle of Wight and poorly connected rural market towns including Kings Lynn, Wisbech and Boston, characterised by high levels of part-time and seasonal employment and low pay.
The data is available to explore in Local Insight. A subscription to Local Insight gives you instant access to more than 1000 datasets, matched to the communities you work in, through maps, reports and dashboards.
We are keen to hear any feedback you have on this data as well as any suggestions for improvement. Please email us on info@ocsi.co.uk

The English Community Needs Index (CNI) 2023 is now published as open…
More
Social housing providers have deep, experience-based knowledge of the communities they serve….
More
Many funding programmes use the Index of Multiple Deprivation (IMD) to identify…
More


