
Understanding deprivation and how to measure it has always been a core part of our work at OCSI. It is a complex and multifaceted concept and having a robust and reliable understanding of the differences in deprivation measures is important for local areas to ensure resources for funding allocation and service commissioning are going to the places most in need.
There are a number of small-area deprivation measures which often aim to capture areas (and the people living in these) on a single scale. Here we explore two measures, The Index of Multiple Deprivation (IMD) and the Household Deprivation measures from Census 2021 and how they compare.
We have been commissioned to update the English Indices of Deprivation (IoD), following a competitive tender process and you can keep up to date with any updates and IoD related analysis through our IoD mailing list.
The Index of Multiple Deprivation (IMD) is one of the most widely used datasets to support decisions regarding local needs. For example, it is used by NHS England in their Funding Allocation Formula, by the Education and Skills Funding Agency for 16 to 19 year olds in schools funding, by Department for Culture Media and Support in their Know your Neighbourhood Fund and by many funders such as People’s Health Trust in their eligibility criteria.
This measure combines together indicators under seven different domains of deprivation: Income, Employment, Education Skills and Training, Health and Disability, Crime, Barriers to Housing and Services and Living Environment. This ultimately provides a single overview of how all areas compare on a comprehensive basket of deprivation indicators. It is widely recognised as the most robust dataset relating to measuring deprivation at a local place-based level.
The broad range of measures that are included in the IMD means it can be used as a headline analysis of deprivation, before delving deeper into each component domain. The index was created at Lower Layer Super Output Area (LSOA) level so it is possible to explore and compare data for small areas.
However, similar to most indices, the IMD is not a direct measure of deprivation with a meaningful score (e.g. you cannot say that one area is twice as deprived as another). Instead, scores from the IMD can be used to compare areas relative to one another. For example, an area with a score of 30 has greater deprivation challenges than an area with a score of 10).
Additionally, as different versions of the index have been calculated differently (e.g. IMD 2015 and IMD 2019), it is not possible to make direct comparisons over time. Trend analyses should only investigate the relative rank differences between years.
Finally, although LSOAs are small-area statistical geographies, using them to create the IMD may result in pockets of deprivation in rural areas being overlooked or hidden.
An LSOA in a rural area may contain multiple villages, where some are much more deprived than others. Here, the IMD score may not highlight the rural LSOA as a whole as one of the more deprived areas, so the more deprived village/s within it may be overlooked.
As part of the process of updating the English Indices of Deprivation, we are collaborating with the Department for Environment, Food and Rural Affairs (DEFRA) to improve how deprivation in rural areas can be measured using small area administrative data.
The Census ‘Household Deprivation’ indicators provide another measure of deprivation.
Similar to the IMD, these indicators encompass different dimensions of deprivation. However, whilst the IMD measures multiple deprivation at a place-based level, this data gives a more granular insight into what is happening in individual households.
It gives us the proportion of households that are classified as deprived in either one, two, three or all of the following dimensions:
Whilst the data included in these dimensions are contemporary and robust, the IMD brings together a larger number of datasets under each domain.
For example, the IMD Employment domain is calculated by investigating those who claim a variety of different benefits – Jobseeker’s Allowance, Employment and Support Allowance, Incapacity Benefit, Severe Disablement Allowance, Carer’s Allowance and Universal Credit in the ‘Searching for work’ and ‘No work requirements’ conditionality groups.
In comparison, the Census household deprivation Employment domain only looks at those who have self-reported that they are unemployed or permanently sick. This is just one example of how the IMD creates a broader definition of deprivation under each domain, which may add greater depth to an analysis and capture pockets of need which are hidden by the household deprivation indicators.
As a more direct measure of deprivation, the household deprivation indicators can be used to say that one area has double the proportion of households with multiple needs compared to another. This differs from the IMD which can only be used as a relative measure.
Additionally, household deprivation data is available down to the smallest statistical geography – Output Area (OA). This means that these indicators may be better than the IMD at capturing deprivation hotspots in rural areas. Another geographical advantage of these indicators is that they capture multiple deprivation experienced by households rather than neighbourhoods. Whilst the IMD can pick out areas in which its residents experience different facets of deprivation, it cannot say if the individual households in that area are experiencing deprivation under multiple domains. The Census indicators do this by identifying households with multiple challenges.
The four domains included in this household deprivation dataset are unchanged from the 2011 Census, so it is also useful to measure change over the 10 year period between the two.
The maps below compare the spatial distribution of the following two indicators using Local Insight: Index of Multiple Deprivation (IMD) 2019 Rank and Households with multiple needs (Census 2021).
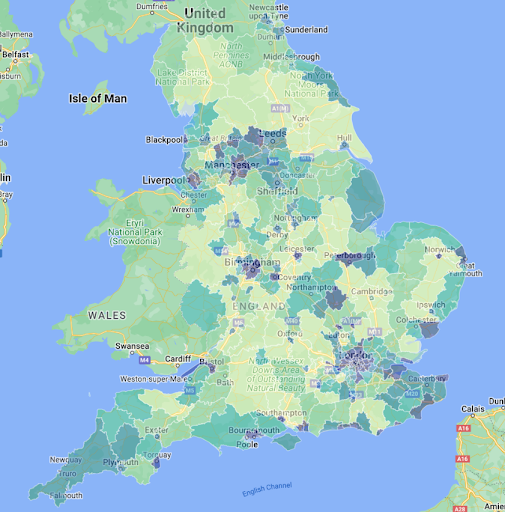
As shown, although both datasets measure similar dimensions of deprivation, they produce slightly different spatial distributions across England. Both measures highlight major cities – such as London, Bristol, Birmingham, Liverpool and Manchester – as deprivation hotspots. However, The IMD captures areas surrounding Sheffield, Nottingham and local authorities across the North of England as more highly deprived. In contrast, the Household Deprivation indicator highlights more rural areas on the South coast and areas surrounding greater London as those which are most in need.
This difference could be down to the Census household deprivation measure being more granular and therefore better able to highlight deprivation challenges in more rural areas.
Additionally, a big difference between the two measures that could account for a difference in spatial distribution is that the Census household deprivation indicators are an individual measure whereas the IMD is an area measure. This means that, whilst you can identify the proportion of households that are multiply deprived on the Census measure, it is important to emphasise that these only represent a small proportion of the population living in these areas, even in the most deprived areas on this measure.
On the other hand, because the IMD captures area-based deprivation, a large proportion of people in the high need areas will be affected one way or another by deprivation challenges. Differences in spatial distribution between the two measures may suggest that the areas with the highest concentrations of households experiencing multiple disadvantages do not necessarily overlap with the areas experiencing highest levels of multiple deprivation.
To summarise, deprivation can be measured in a number of ways. It is important to note that there are strengths and weaknesses associated with both measures discussed here, which make them useful for different purposes. Although the IMD remains the most widely recognised small-area measure, the Census household deprivation indicators can add more granularity to the picture by highlighting households in need. This is practical in rural areas where smaller deprivation hotspots may be overlooked using the IMD.

The English Community Needs Index (CNI) 2023 is now published as open…
More
Social housing providers have deep, experience-based knowledge of the communities they serve….
More
Many funding programmes use the Index of Multiple Deprivation (IMD) to identify…
More


