Mind the gap! Visualising small area housing affordability data | Part two

Decorative image with the text "data analysis"


Last month Colin Wojtowycz of Datawoj Ltd shared some of his knowledge and experience of using data visualisation to tell an engaging and convincing story.

We are thrilled to welcome him back for part two of this series. In the first instalment, Colin looked at what the national story was in relation to housing affordability, picking out the most and least affordable places to live. And talked through some of the data visualisation techniques and best practices he used. (If you missed it, you can read the blog here.)

And now he delves in further, to look at some local, rural housing affordability issues.

Methodology:

Using data available in Local Insight, I combined the local area housing affordability data with data visualisation software, Tableau Desktop to explore housing affordability trends in depth.  Tableau Desktop’s spatial connector allows datasets with an area code to be quickly combined with a spatial file of the same area type.

In this case; housing affordability data for very small areas called ‘Lower Layer Super Output Areas’ (LSOAs have  an average resident population of 1500 people) was connected to a spatial file available openly from the Ordnance Survey.

The dashboard is available on the Datawoj Tableau Public Page

Average House Price Affordability Cheshire East 250917 d

Once connected measures were ‘dragged and dropped’ onto the view to explore the data and create bespoke charts and maps.  These were combined onto a dashboard, which allows for context, charts and analysis to be combined into an engaging narrative.

The goal was to highlight key insights within a story based narrative, which aims to guide the user through the analysis. Some of the techniques used to aid this include:

  • The use of consistent colour throughout frames the context of most affordable compared to least affordable in the study area.
  • The use of big numbers linked to the study map acts as colour legends.
  • A symbol map shows the centre of each LSOA, colour coded according to the average housing affordability gap.  Each symbol point is semi-transparent and bordered to enhance visibility despite overlapping.
    • The advantage of this approach is that symbol points are equally sized so are not affected by the same distortion, which mapping data to LSOA boundaries of different sizes can be.  For example, large rural LSOA boundaries tend to stand out more than smaller urban ones, despite having approximately a similar population of 1,500 residents.
    • The disadvantage of this approach is that the dots represent the centre of LSOAs rather than real World geographies, which could cause confusion.
  • The distribution of housing affordability is presented through a ‘box and whisker’ plot.  
    • Each dot represents the centre of an LSOA as plotted on the symbol map.  The whiskers represent the lower and upper reach of outlier points.  The middle of the box is the median value and the two adjacent inner quartiles of data points.
    • The advantage of this approach is that it shows the range of distribution within an area and therefore the challenge in terms of housing affordability that a local authority has to deal with.
    • The disadvantage of this approach is that not every point can be seen due to overlapping.  Although, the presentation of the box and whiskers means that this may not be necessary.  Additionally, these charts are sometimes a challenge without prior instruction.
  • To aid with interpretation a ‘highlight action’ is applied which links the points on the map to the points on the chart when hovered over.

Key Findings:

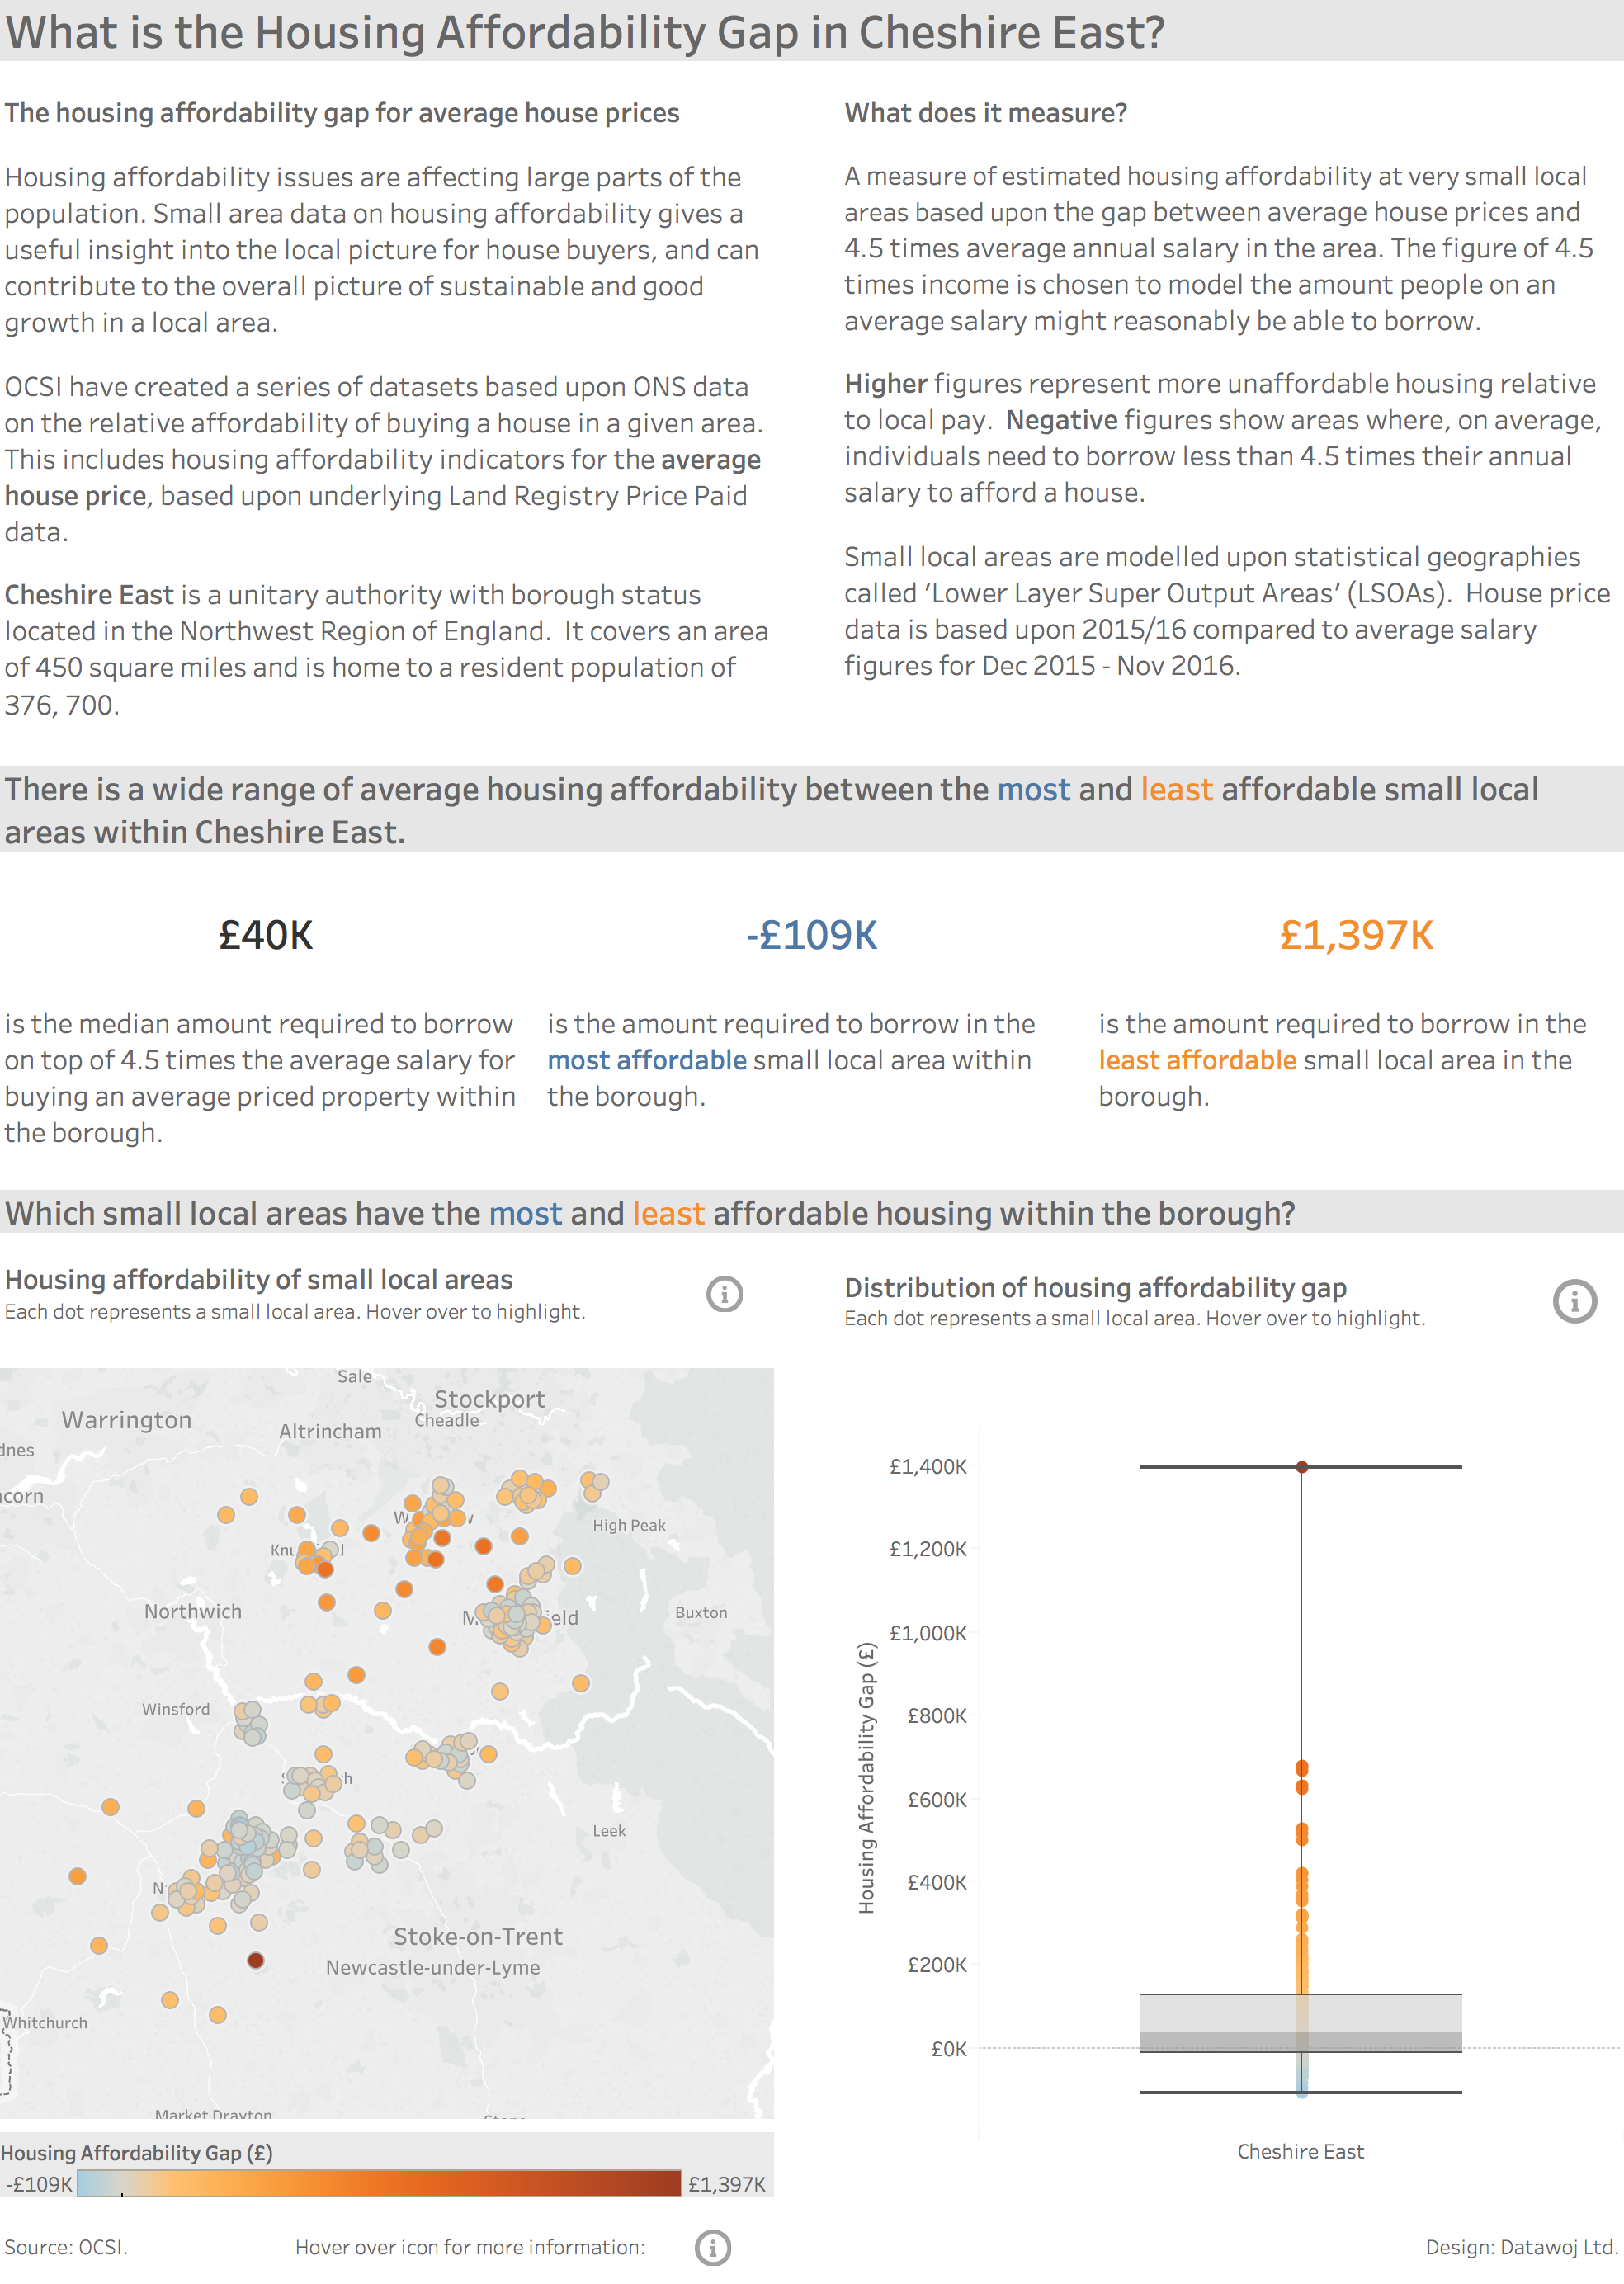
This visualisation compares the median housing affordability gap for average priced housing between the most and least affordable small local areas within the borough of Cheshire East.  The median amount is used to reduce the effect of outliers upon the average housing affordability gap.

  • There is a disparity between the median housing affordability gap between the most and least affordable small local areas within Cheshire East.
  • The most affordable small local areas are located within the population centres, whereas the least affordable small local areas are located in rural areas in-between.

Benefits of this approach:

  • Quick and accurate insights at a glance provide better evidence for decision making to inform housing marketing strategy at a local level.
  • Innovative solutions to complex problems help balance service delivery with future demand for insight.
  • Engaging analysis raises the profile of the researcher to the target audience.

Challenges of this approach:

  • To condense technical information into an easy to understand visual narrative.
  • Knowledge and iterative practice of effective data visualisation techniques is required to communicate the insights effectively.
  • To employ effective data visualisation requires understanding the context of the needs of the target audience.  The value of the analysis is dependent upon what outcomes are improved as a result.


Colwoj ProfileDatawoj Ltd. is an independent consultancy specialising in data visualisation for social research and business intelligence.  It draws upon 18 years in Local Government specialising in socio-economic research and public consultation. To find out more get in touch on colin@datawoj.co.uk or visit https://datawoj.co.uk/


Featured posts

Decorative image with the text "Community Needs Index"

Data analysis

What is the Scottish Community Needs Index?

OCSI created the first version of the Community Needs Index in partnership…
More

Decorative image with the text "Job vacancy"

OCSI news

Job Vacancy: User Support Officer

We are looking for a User Support Officer to join the team…
More

Decorative image with the text "Job vacancy"

OCSI news

Job Vacancy: Customer Support Manager

About OCSI Based in Brighton, we are a social research consultancy with…
More

Case studies
Data analysis
Featured
Indices of Deprivation
left behind neighbourhoods
OCSI news
Research Projects
Resources and data
Uncategorized