
The cost of housing is never far from the policy agenda and with the Department for Communities and Local Governments born again as the Ministry of Housing, Communities and Local Government, it is clearly remaining an area of focus at the national and local level. We want people working on housing policy locally to have the best picture possible of the local housing market and how it relates to the wider economy. And so, we have now added to Local Insight additional measures of the local housing market:
(Last year, we also added housing affordability measures to Local Insight – small area ratios of earnings to house prices.)
For the data aficionados among us, there is more information on how these datasets were constructed at the bottom of the blog.
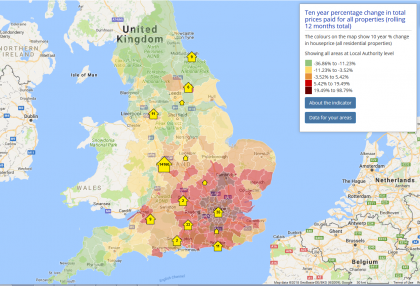
Across England, house prices have recovered from the fall during the financial crisis and are rising once again.

However, whilst the national picture is one of increasing house prices, looking at the price changes over the past ten years at the local level reveal clear regional divides illustrated by the map below. Areas in London and the neighbouring counties are seeing house prices rise above inflation whereas areas in the Midlands, North and West of the country, are seeing modest rises at best with many prices in these areas falling relative to inflation.¹
 (You can explore some of this data right away for yourself on our public site.)
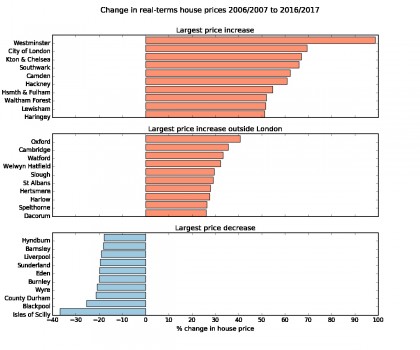
The ten local authorities with the largest price increases are all, unsurprisingly, in London. Excluding London Boroughs, the top ten authorities are all found in the South East of the country. The ten local authorities with the largest decreases in real-terms house prices are more dispersed but predominantly located in the West and the North.
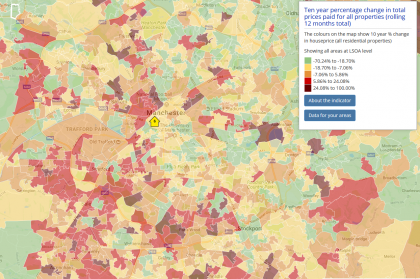
At local authority level, Manchester and the surrounding areas sit in the second and third quintiles (the second and third bands of lowest price growth). Viewing the data at LSOA level for these areas reveals the large variation between small areas within the local authority. Although on average the area has seen price stagnation and moderate price decreases, in certain places real-terms prices have increased by 25-100%. This illustrates the high level of variation in house price changes locally over the past decade and the value of small area data.
Also new to Local Insight is a measure of the proportion of properties in an area that have been transacted over the past year.
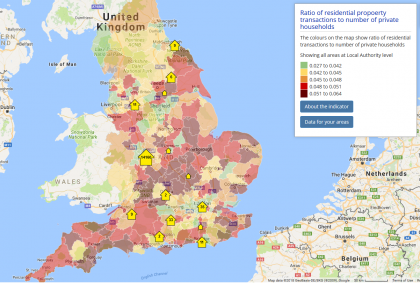
There is no clear overlap between the local authorities with high growth in house prices and high levels of housing ‘churn’. London and the South East clearly do not dominate with either high or low housing churn. Instead, it appears that rural areas have the highest numbers of transactions for the amount of private dwellings.
Sign up for a free trial for access to the 1000+ local level datasets we hold, instantly aggregated to the areas you work in.
Start a free trial of Local Insight and
More on the data
We have used the CPIH index to account for inflation. This is the lead inflation index used by the ONS. The CPIH is a national measure not available at lower geographies. Although price change will vary across the country there is no simple way to account for this.
The housing ‘churn’ indicator is calculated as: the total number of residential transactions / the total number of private dwellings (owner occupied or private rented dwellings). There are a number of caveats to be aware of when interpreting the data 1) the data is taken from the 2011 Census so will not capture private dwellings constructed since 2011 2) there are relatively higher levels of transactions of owner occupied dwellings compared with private rented dwellings which for simplicity we have not attempted to model 3) a small number of property transactions will be from formally social rented dwellings e.g. those acquired under Right to Buy.
Caveats and assumptions: House price data are taken from Land Registry transactions data and do not reflect the change in value of individual properties but the average value of transacted properties. Where a substantially different set of properties are transacted between time points, this can distort the overall trend (an extreme example would be an area seeing comparatively large number of sales of one bedroomed flats in 2006 compared with a relatively large number of sales of six bedroomed mansions in 2016 which could result in an overestimate of the house price growth in the area).
¹ Adjusting for inflation means real-terms house price change is measured – the change in house prices relative to changes in price of goods and services across the wider economy. Although the measures of inflation are imperfect and only available at the national level, they give an idea of the purchasing power a house owned today has compared to a house owned ten years ago.

The English Community Needs Index (CNI) 2023 is now published as open…
More
Social housing providers have deep, experience-based knowledge of the communities they serve….
More
Many funding programmes use the Index of Multiple Deprivation (IMD) to identify…
More


