If ever there was a time of year to get an exciting event in the calendar for an inspiration boost; mid November is it! And the first Data4Good conference in Birmingham did not disappoint.
Data4Good brought together data heroes from across the not-for-profit sector to explore what exactly ‘data for good’ meant to them.
Data for good is the very essence of what we do at OCSI and thoughts are still buzzing around after a day of chatting with like-minded individuals. Here’s our round-up from the day.
With so much data available at our fingertips, how can we be sure the data that we are using is trustworthy, reliable, and the most appropriate information for our work?
This cropped up a few times throughout the day – and something we think about a lot when adding new indicators to Local Insight.
These are by no means all the answers, but a good ‘Starter for 10’ might be:
Who collected and produced the data?
Some questions you might want to ask to help inform your decisions:
Can you make comparisons over time?
If seeing change over time is a necessary part of the narrative you wish to build, you may need to check that data for multiple time-points is available.
Lots of government open datasets are published monthly (e.g. unemployment data from DWP). Others are published much less regularly, or as a one-off releases(e.g. Prevalence of loneliness data from Age UK).
Is the data out there fit for your purpose?
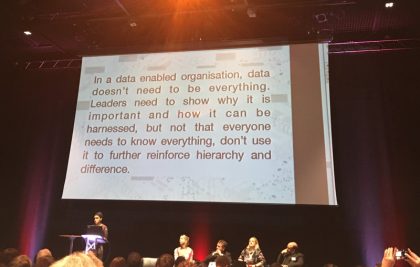
Image credit: @alex_vanvliet https://twitter.com/alex_vanvliet/status/1062661691324932097
During one of the workshop sessions on Evidencing Impact, the importance of considering why you’re measuring, collecting, recording, publishing data was discussed.
The message we came away with was: if it’s not of use or isn’t going to be used to drive behavioural change – drop it.
Having a clear rationale and (set of) question(s) that you want to answer using the data can help you see the wood for the trees (or see the wood for the CSVs if you get my drift…).
Perhaps the biggest takeaway from the day is just how much is going on within the sector – and the wealth of resources and knowledge that is already available.
A few resources and tools that were mentioned in conversations and sessions we took part in throughout the day below.
We also have lots of data resources and guides available on our website. Sign up to our mailing list to be kept in the loop with this and other data related delights.
It was a pleasure to meet so many of you on the day. If you didn’t make it to our stand at the conference but would still like us to send you a profile report for an area you are interested in, get in touch on kimberley.anscombe@ocsi.co.uk
You can also sign up a free trial of Local Insight, for instant access to more than 800 local level socio-economic datasets, aggregated to the communities you care about.
Here’s hoping Data4Good becomes an annual event!

The English Community Needs Index (CNI) 2023 is now published as open…
More
Social housing providers have deep, experience-based knowledge of the communities they serve….
More
Many funding programmes use the Index of Multiple Deprivation (IMD) to identify…
More


