
The latest additions to Local Insight are an interesting bunch. Not least because they are local health datasets and also because they are so relevant to a number of different sectors, job roles and priorities.
The 21 new indicators added look at estimated prevalence of a number of health conditions. Read on for more information on the datasets, a closer look at the prevalence of dementia and how you can explore the data for yourself.
The new indicators were originally collected and published at GP practice level by NHS Digital. Data collected at GP level can be very valuable for identifying the health challenges experienced by individual GP practices and their patients. However, for the purpose of analysis, it can present some challenges as it is not straightforward to link practice data to standard statistical geographies – patients living in the same neighbourhoods can attend different GP practices, and patients are not necessarily registered with their local GP, so it is difficult to straightforwardly attribute GP data to the neighbourhood in which the GP is located in.
The Commons Library have recently taken these indicators and aggregated them to MSOA level in order to estimate disease prevalence, so that the insights from the data can be used in a more place-based way.
The 21 new indicators are the estimated prevalence of Atrial Fibrillation, Asthma, Cancer, Coronary Heart Disease, Chronic Kidney Disease, COPD, Cardiovascular Disease, Dementia, Depression, Diabetes, Epilepsy, Heart Failure, High Blood Pressure, Learning Disabilities, Serious Mental Illness, Obesity, Osteoporosis, Peripheral Arterial Disease, Pallative Care, Rheumatoid Arthritis, Stroke and Transient Ischaemic Attack.
For more detail on the methodology used to aggregate GP level data to MSOA, take a look at The Commons Library’s documentation.
As with any dataset, these indicators come with their own challenges and caveats. These datasets are estimates and based upon what has been reported to GPs. The following guidance on using the datasets has been taken from The Commons Library:
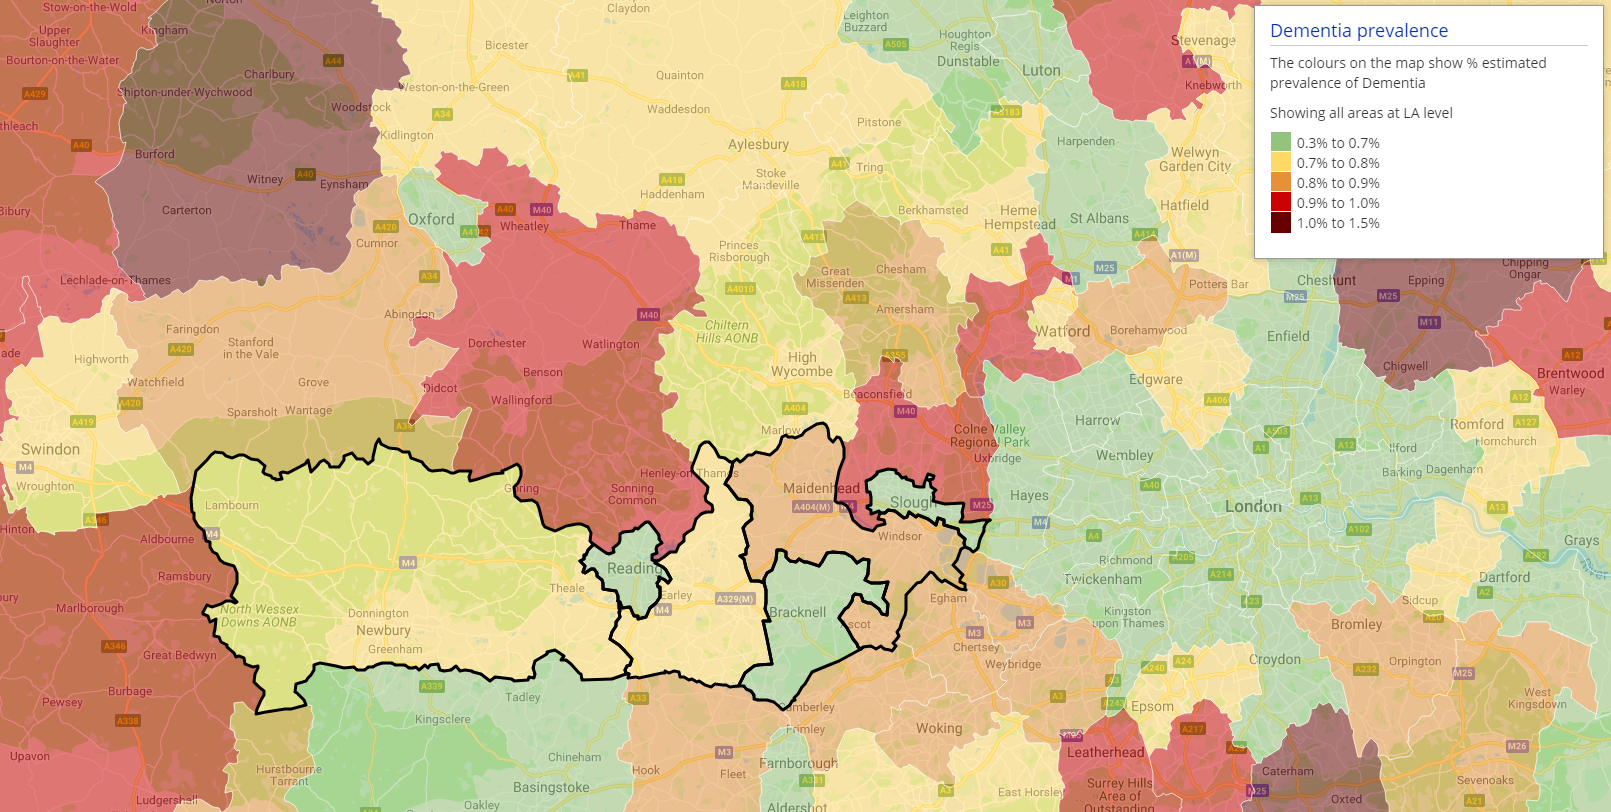
Dementia Prevalence across Berkshire and the surrounding areas. Map taken from Local Insight.
Using Local Insight, we have taken a look at one of the indicators in more detail – the estimated prevalence of dementia across Bracknell Forest. The estimate is calculated as a percentage and is based on the number of people listed on GP registers in 2017/18, and the number of people recorded as having dementia.
The estimated prevalence of dementia at a national level is 0.8%. Bracknell Forest has a slightly lower estimated prevalence at 0.6%. This is equal to the average prevalence across the whole of Berkshire (defined as Bracknell Forest, Reading, Slough, West Berkshire, Windsor and Maidenhead, Wokingham). Of the local authorities in Berkshire, Windsor and Maidenhead has the highest estimated prevalence of dementia (0.9%) and Slough the lowest (0.4%).
When looking at the estimated prevalence of dementia across wards in Bracknell Forest, Crown Wood ward has the lowest estimated prevalence of dementia (0.3%) and and Winkfield and Cranbourne ward has the highest (1.2%).
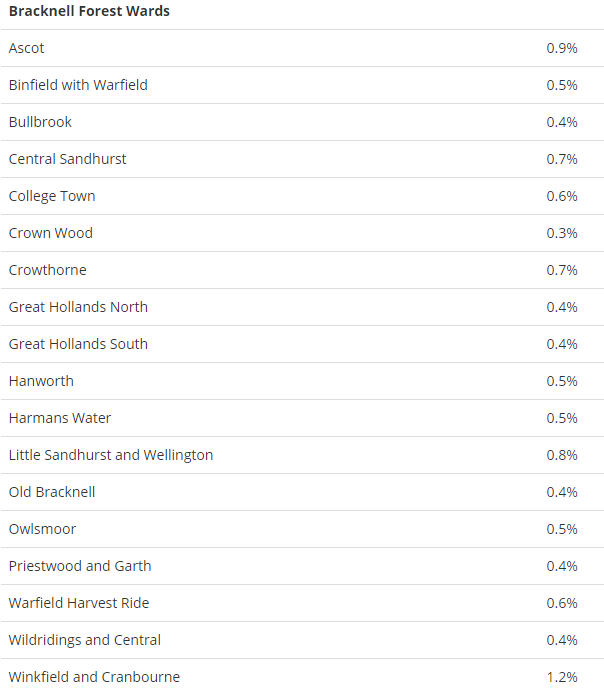
Estimated prevalence of dementia across wards in Bracknell Forest. Table taken from Local Insight.
Digging into the data for the areas you care about is made super simple with Local Insight. It provides instant access to more than 900 local datasets, including a wide range of health related datasets.
To take a look for yourself and gain a better understanding of health conditions to inform decisions, request a free trial of Local Insight.

The English Community Needs Index (CNI) 2023 is now published as open…
More
Social housing providers have deep, experience-based knowledge of the communities they serve….
More
Many funding programmes use the Index of Multiple Deprivation (IMD) to identify…
More


