How to use the ONS Open Geography Portal

Decorative image with the text "How to guides"

The ONS Open Geography Portal is a useful resource for anybody working with a range of UK geographies. 

This guide provides an introduction to the ONS Open Geography Portal and some of the functionality that you may find useful (especially for creating custom geographies in Local Insight).

This guide is for you if you:

  • Want a better understanding of the different components of UK Geography
  • Struggle to find the area definitions for places you care about
  • Want to know which statistical geographies are relevant to the areas you work in

What is the ONS Open Geography Portal?

The ONS Open Geography Portal provides free and open access to ‘geographic products’. It holds a range of products that support the use of geography in statistical processes including:

  • Boundaries
  • Postcode directories
  • Lookup files 
  • Name and code files.

There is a comprehensive FAQ document available online.

What types of areas does the ONS Open Geography Portal cover?

The ONS Open Geography Portal covers all geographical breakdowns across England, Wales, Scotland and Northern Ireland.

  1. Administrative geography: Areas that relate to national and local government structures (eg. counties, local authority districts, wards and parishes)
  2. Census geography: Statistical geographies that Census (and many other datasets) are published at (eg. Output Areas (OAs)  and Super Output Areas (SOAs))
  3. Electoral geography: The different areas used to elect members to various levels of government (eg. parliamentary constituencies, devolved parliaments)
  4. Health geography: The organisations of the NHS (eg. Clinical Commissioning Groups, Integrated Care Boards)
  5. Postal geography: UK wide system of postcodes.

Read the Beginners Guide to UK Geography for more detail.

Downloading shapefiles for your areas from ONS Open Geography Portal

What is a shapefile?

Shapefiles are a spatial data format that can include points, lines and polygons.  They can represent geographic boundaries, eg – for wards, local authorities or parishes.

Shapefiles consist of 3 mandatory files:

  • Main FIle (.SHP): This represents the spatial data (eg. points, lines and polygons on a map)
  • Index File (.SHX): This type of file is used by whatever is reading the shapefile to easily find what it is looking for (like an index in a book)
  • dBASE file (.DBF): This is used to store all the attribute data for your shape (such as the area names and codes).

Index files and dBASE files are both required to read the Main file. 

They can represent geographic boundaries, eg – for wards, local authorities or parishes and are used primarily within Geographic Information Systems.

How to download shapefiles for your areas from the ONS Open Geography Portal

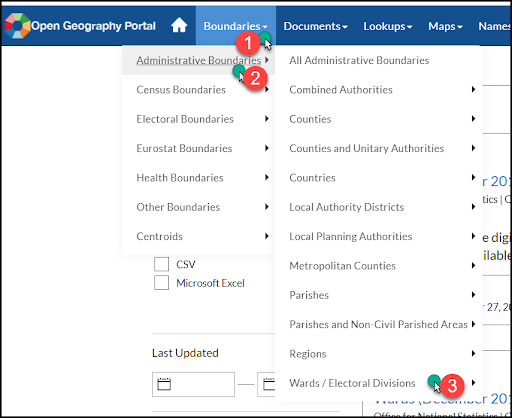
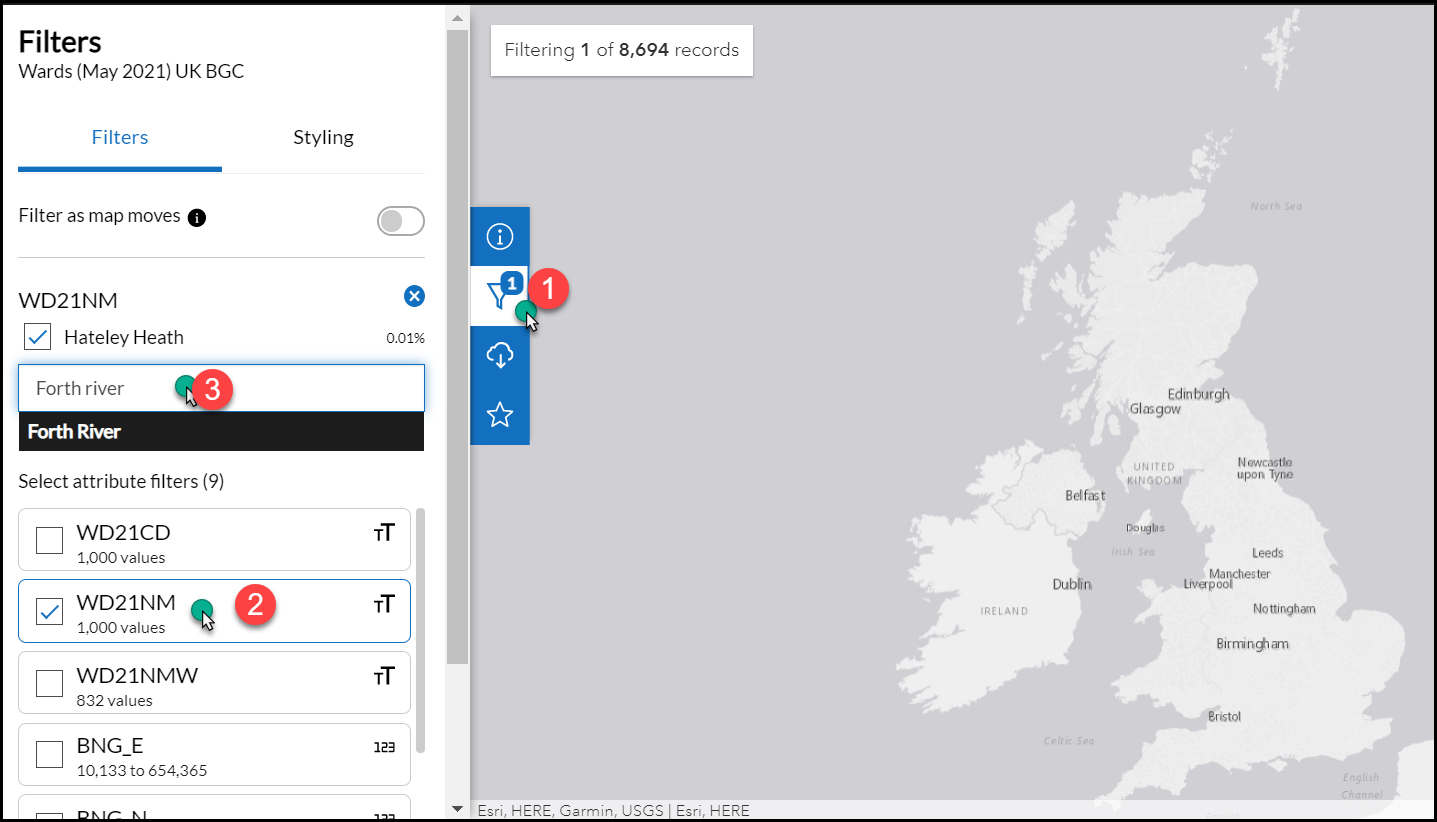
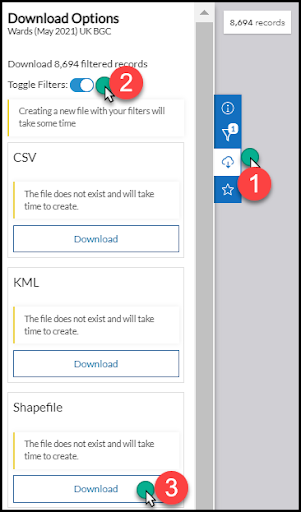
The below example shows you how to download shapefiles for wards. 

  1. Under the Boundaries tab, navigate to Administrative Boundaries and then Wards / Electoral Divisions.

A screenshot showing how to fins shapefile boundaries on ONS Open Geography Portal

  1. Select the time point for the data you are interested in (ward boundaries changes annually)
  2. Select the resolution that is most suited to your needs.
    1. BSC Super generalised (200m)
    2. BGC Generalised (20m)
    3. BFE Full resolution
  3. Filter the file to find the wards you are interested in using the filter icon on the map (see 1), selecting how you want to filter the data (see 2) and searching for specific areas (see 3).

A screenshot showing how to filterwards on ONS Geography Portal

  1. Select Download to open the download options (see 1 below)
  2. Ensure that you turn on Toggle Filters, otherwise you will download the entire unfiltered file (see 2 below)
  3. Download the shapefile option (see 3 below)

Importing shapefiles into Local Insight

You can import shapefiles into Local Insight. This is a great way of creating multiple custom areas at once.

A couple of things to note while preparing your shapefile:

  1. You will need to choose the BGC Generalised (20m) format – see step 3 in the guidance above
  2. You will need to know the name field for your shapefile – this identifies where the area names are located. You can find this information through opening the .dbf file in Excel.

For step by step guidance on importing your shapefiles, please see our Help Centre.

Using lookups

What is a lookup?

Lookup files allow you to relate one or more geography to another. For example:

  • Which Output Areas (OAs)are included in a particular ward?
  • Which OAs are included in a particular parish?
  • Which Lower Super Output Areas (LSOAs) are included in a particular local authority? 
  • Which local authority districts make up a county?

Lookup files can be downloaded as MS Excel documents. Through filtering the file you can find out which geographies are used as building blocks for other geographies.

As most geographic datasets are published at statistical geographies such as OAs and LSOAs, using lookups can be a useful way to identify the data that corresponds to the areas that you are interested in.

How to use a lookup

There is a huge range of lookups available on the ONS Open Geography Portal. These are all available under the Lookups tab on the navigation bar. 

This example looks at using a ‘best fit’ lookup between OAs to Wards.

  1. Navigate to the OA  – Wards lookup (this can be found by clicking on lookups -> best fit lookups -> OA – Wards)
  2. Find the most recent ward definitions (at the bottom of the page)
  3. Download the Excel spreadsheet
  4. Filter the spreadsheet to make it easier to find the information you are looking for (eg – filter by local authority to narrow your search)
  5. You should then be able to identify which OA codes (see column A) make up the ward that you are interested in (see column C)

How to create areas from OAs and LSOAs in Local Insight

You can quickly and easily create areas through selecting from a list of LSOAs. 

For areas based on OAs, please email support@ocsi.co.uk and we can help add your areas into Local Insight.

Request a demo of Local Insight

Local Insight takes the pain out of defining the areas you care about. You can quickly and easily create areas through:

  • Drawing a boundary on a map
  • Uploading postcodes or 
  • Selecting from standard areas

All of the data in Local Insight (more than 1100 indicators) is then instantly aggregated to the areas you care about – ready for you to explore through maps, dashboards and reports.

It really is as easy as that. If you want to see for yourself, please get in touch for a demo.


Featured posts

Decorative image with the text "OCSI news"

OCSI news

Announcing Local Insight 2.0, the place-based data platform from OCSI

We are proud to announce that we have successfully redeveloped and launched…
More

Decorative image with the text "Community Needs Index"

Data analysis

What is the Scottish Community Needs Index?

OCSI created the first version of the Community Needs Index in partnership…
More

Decorative image with the text "Job vacancy"

OCSI news

Job Vacancy: User Support Officer

We are looking for a User Support Officer to join the team…
More

Case studies
Data analysis
Featured
Indices of Deprivation
left behind neighbourhoods
OCSI news
Research Projects
Resources and data
Uncategorized