
Understanding the wider determinants of physical and mental health is an issue that local authorities, grantmakers, charities and researchers are forever grappling with. Having a better grasp on the underlying causes of health issues is an important part of improving public health outcomes for all and reducing health inequalities. Our newest set of indicators in Local Insight have a potentially important place in this space of thinking. Access to Healthy Assets and Hazards (AHAH) from University of Liverpool and CDRC is a suite of 21 indicators (including a multi-dimensional index), that looks at how accessible certain health-related environmental features are to individuals. This covers, for example, proximity to GPs (an asset) to access to fast food outlets (a hazard).
This is the first time that a comprehensive small-scale set of indicators like these have been made available as open data with national coverage and there are exciting implications for supporting and informing decision making. The indicators included are from the recently updated version of Access to Healthy Assets and Hazards (which includes an additional indicator).
This blog will provide more information on the data (although for a much more detailed explanation, please read the technical report) as well as looking at how organisations may want to use this in practice and the ways Local Insight can support this work.
This is a vastly simplified summary of the datasets, so for the #dataheroes among us, please read the technical report, which goes into a lot more detail on the methodological choices made when constructing the datasets.
The individual indicators are based upon four domains of accessibility;
The individual indicators are combined to create the overall index, using an adapted version of the methodology for the Index of Multiple Deprivation. All data is published at LSOA level (or the equivalent Data Zones for Scotland) with larger scores depicting poorer health-related environments.
The datasets can be accessed via CRDC.
As with all datasets, there are some limitations in using these indicators. The academic paper from the first version of the index has more detail on each of the points below:
Some of the use cases below are sourced from the previously mentioned academic paper.
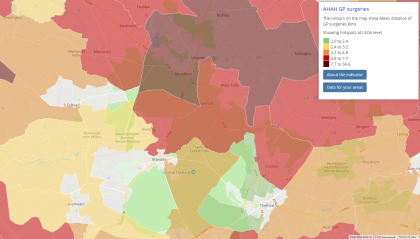
The datasets can provide insight into whether services are provided in areas that are most in need. The dataset itself could help to flag up hotspot areas that have the poorest access to services. Using Local Insight, you can identify these areas quickly and easily using hotspots and then overlay this data with your locally held data on individual local assets (such as GP practices & pharmacies), in order to start conversations and inform commissioning decisions.
In addition, you could also compare the data with socio-economic indicators on the dashboard to quickly and easily identify areas with poor access to health services that have high health needs.
There is an argument that the sources of services and goods we have access to may shape our behaviours. For example, some research has shown that individuals who have a greater number of fast food outlets within their vicinity can be associated with risk of obesity and the proximity to gambling outlets may affect the risk of problem gambling behaviours.
With this in mind, being able to identify areas with a particularly large score in relation to hazards could be useful in targeting public health communications and resources to these areas. Furthermore, it could have implications for planning and licensing teams and the public health implications for any new premises.
The Index of Access to Healthy Assets and Hazards could also be useful to compare with locally held data to test underlying assumptions about which areas have most or least access to these services.
Finally, as this data has been made available as open data on a national scale, there are lots of opportunities for better partnership working both across institutions and local authority boundaries, through removing some of the barriers associated with sharing data. For organisations that have a public-facing Local Insight site, this means that stakeholders from across local authorities, CCGs and the local community and voluntary sector can all find and use consistent, up-to-date and robust data around local assets and hazards.
Equally, as the methodology has been applied consistently across all areas, it is possible to make comparisons across different local authorities with less risk of local bias. In practice, this means local authorities can compare their own areas to other authorities that are experiencing broadly similar socio-economic challenges, but with a substantially different outlook when it comes to Access to Healthy Assets and Hazards. This could lead to better sharing of resources & knowledge around policy-making and initiatives that are most likely to have a positive impact.
To explore the data in more detail and see how your community fares, sign up for a free trial of Local Insight.

The English Community Needs Index (CNI) 2023 is now published as open…
More
Social housing providers have deep, experience-based knowledge of the communities they serve….
More
Many funding programmes use the Index of Multiple Deprivation (IMD) to identify…
More


