The term left behind neighbourhoods is featuring more and more in social policy discussions with a range of studies starting to explore underlying factors contributing to communities being ‘left behind’. (These include low levels of social mobility, low skills or declining industries and exclusion from external investment by the public and voluntary sector.) However, until now, there hasn’t been a statistical definition of left behind neighbourhoods.
Local Trust commissioned OCSI to develop a quantitative measure of left-behind neighbourhoods using open data, including developing for the first time, a Community Needs Index.
The resulting report ‘Left behind? Understanding communities on the edge’ suggests that multiply deprived areas, when combined with the absence of places to meet, the lack of an engaged community and poor connectivity, fare worse than other deprived areas.
We’ll be putting together some additional resources on the Community Needs Index for the data aficionados over the coming weeks, so keep your eyes peeled for that (or sign up to the mailing list and it will be delivered straight to your inbox).
The data is also available in our Local Insight platform so that you can explore the data for any area or community you care about, alongside more than 1000 other socio-economic indicators.
The Community Needs Index is particularly exciting as it focuses on the social and cultural factors that can contribute to poorer life outcomes in communities, which gives a different perspective to more economically based measures of local need. This is a useful measure in and of itself, to help policy makers target investment in social infrastructure.
The Index has been developed at ward level as opposed to LSOA level (please see the full report for the reasoning here), and covers 19 indicators across the domains of:
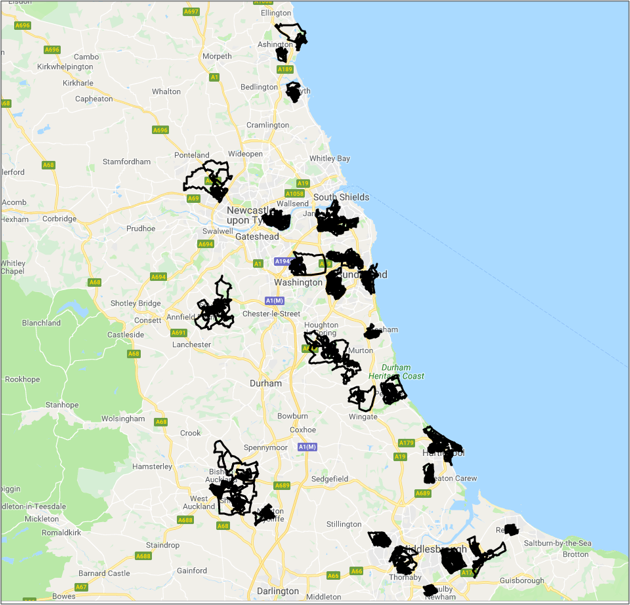
Left behind neighbourhoods in the North East are concentrated in former mining communities and fringe areas in Teesside and Tyne and Wear
To identify neighbourhoods that could be defined as left-behind we focused on the areas that suffered the dual disadvantage of
We, therefore, sought to explore the characteristics of areas that were ranked in the worst ten per cent in both the Community Needs Index and Index of Multiple Deprivation (IMD) 2015.
The analysis has identified 206 left-behind wards in England with a combined population of 2,193,000 people – almost 4% of people in England. The research shows concentrations of left-behind neighbourhoods in housing estates outlying big towns and cities, such as Greater Manchester, Merseyside, Birmingham, Middlesbrough, Hull and Stoke, as well as in post-industrial areas in northern England and coastal areas in southern England.
45 wards in the North East fall into the category of left behind, representing 13.3% of all its wards – the highest percentage of any region. Meanwhile, 52 wards in the North West are classified as left behind – the greatest number of any region – representing 5.6% of all wards there.
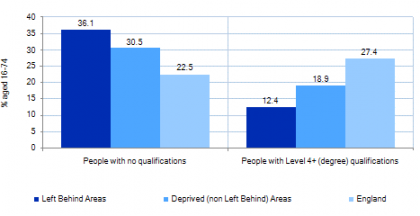
The report looks at the demographic and socio-economic characteristics of the neighbourhoods identified as left-behind and compares these with other multiply deprived areas as well as the population of England as a whole. This covers themes such as employment, education and skills, living standards and health. Our slide pack of data analysis (available to download here) includes graphs and charts for all key data used in the analysis as well as location maps for left-behindneighbourhoods.
Stefan Noble, Head of Research at OCSI notes “some of the findings are very striking, for example, unemployment and benefit claimant rates are double the national average, one in three children are living in poverty and more than 36% of the adult population hold no formal qualifications. There is also some evidence that the areas we have identified as left-behind are falling behind other deprived areas on key socio-economic outcomes.”
Read the full report ‘Left behind? Understanding communities on the edge’ and please send us your questions and thoughts to info@ocsi.co.uk
Find out more about our research services.

The English Community Needs Index (CNI) 2023 is now published as open…
More
Social housing providers have deep, experience-based knowledge of the communities they serve….
More
Many funding programmes use the Index of Multiple Deprivation (IMD) to identify…
More


