
We know how informative data on grants can be, especially in terms of coronavirus (COVID-19) response planning. Accessing this kind of data is of great value as it gives us an idea of where funding and resources are being channelled and whether this funding is reaching the areas with the highest needs. It has become clear that some areas have experienced a disproportionate impact from COVID-19, and it’s important we identify these areas to help inform and evidence funding allocation and decisions. We recently loaded a new indicator into Local Insight that measures grants issued in response to the COVID-19 pandemic, effectively capturing the response to the pandemic from third sector organisations.
This indicator, Grants issued in response to COVID-19, is sourced from data collected by 360Giving on grants issued to support community groups that address the challenges arising from COVID-19. The data was extracted as a snapshot on the 20th April 2021; we are aiming to update the data on a quarterly basis. The recipient location of the grants issued is a mixture of recipient organisations and beneficiaries, depending on the convention of the grant funder. The data available was for individual grants in a raw format with grid references. We have then identified which Output Area each individual point falls within using GIS software. From this, we were able to create a count of the total number of grants in each Output Area and then calculated this as a rate per 100,000 people.
Grants included use the terms “COVID”, “coronavirus”, “pandemic” or “cv19” somewhere in the grant description, title, classification, or grant program; we have only included grants that we have been able to geocode; any grants without this classification will not be included. Because the data contains a mixture of recipient organisations and beneficiaries, this may omit areas that have benefited from grants issued to organisations that operate in locations separate to their listed address.
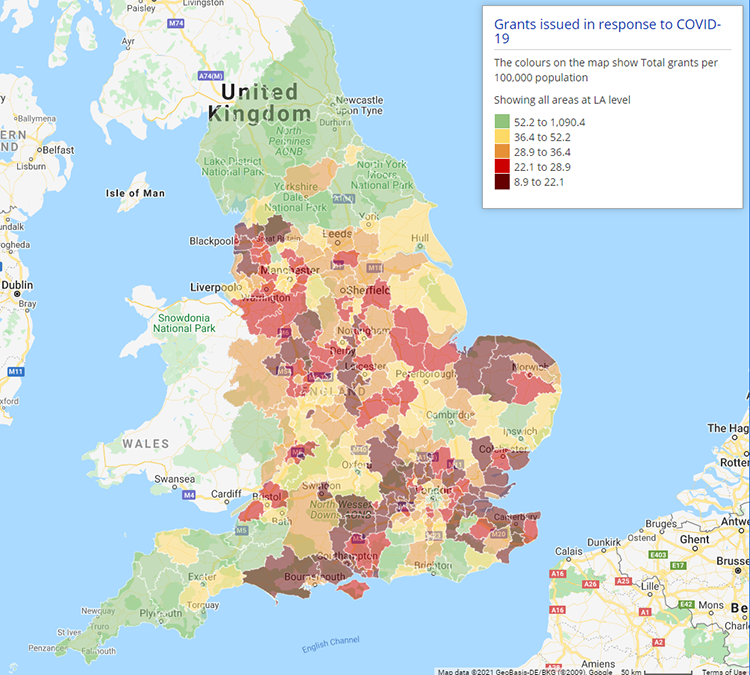
The levels of grants issued in response to COVID-19 vary across the country, with high concentrations of activity in the London boroughs, and other districts across the South West, South East and North of England. Somerset West and Taunton, Southwark, Brighton and Hove, Mendip and Cambridge have all received a high proportion of grants during the pandemic, unlike other parts of the South East and East region that have had limited grant activity in response to COVID-19. Castle Point, Hart, Havant and Stevenage, Southampton and Tendring have all received some of the lowest proportions of grants during the pandemic.
As we’ve seen during the past 15 months, disparity in outcomes and pre-existing inequalities has been intensified for different groups and communities by the pandemic. Areas with already high levels of need tend to be disproportionately affected by COVID-19, therefore, the direction of funding and third-sector activity in these areas is imperative for bridging these gaps.
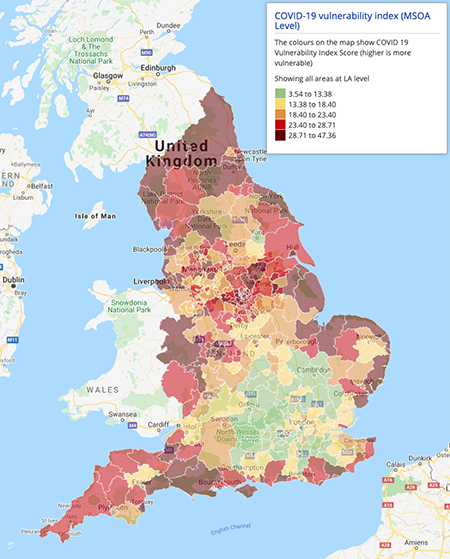
Using the COVID-19 grants indicator we can compare against measures of need. We have looked at this indicator in context to other needs measures in Local Insight: the COVID-19 vulnerability index, Indices of Deprivation, and the Community Needs Index, and identified at-risk areas and areas where there may be high levels of unmet need with no significant investment or interventions yet.
The COVID-19 vulnerability index, produced by the British Red Cross, identifies neighbourhoods ‘at risk’ from the effects of COVID-19. We can capture whether funding is going to those most likely impacted by the pandemic by using this indicator alongside the grants issued in response to COVID-19 indicator.
When looking at the COVID-19 vulnerability index, the top 20 Local Authorities which score as having higher overall vulnerability to COVID-19 have a corresponding variety of results in terms of grant activity. Some areas appear to be receiving high levels of grant activity relative to their identified needs – Scarborough, Copeland and Torbay in particular.
This story differs in the East coastal areas: the districts of North Norfolk and Tendring both have high vulnerability scores and low levels of grant activity in response to COVID-19.
| Local Authority | COVID-19 vulnerability index (score) | Total grants issued in response to COVID-19 (per 100,000 population) |
|
East Lindsey |
47.4 |
43.7 |
| North Norfolk |
42.6 |
19.1 |
| Wyre |
42.6 |
17.8 |
| Blackpool |
42.2 |
25.8 |
| Tendring |
41.7 |
14.3 |
| Walsall |
38.6 |
26.3 |
| Scarborough |
38.4 |
65.3 |
| Copeland |
38.3 |
67.5 |
| Rother |
38.2 |
46.8 |
| Torbay |
37.8 |
60.2 |
| Great Yarmouth |
37.4 |
32.2 |
| Wyre Forest |
37.0 |
29.6 |
| Knowsley |
36.8 |
32.5 |
| Fylde |
36.6 |
14.9 |
| Sandwell |
36.4 |
28.0 |
| Wolverhampton |
36.3 |
34.2 |
| Chesterfield |
35.4 |
35.3 |
| Dudley |
34.7 |
23.0 |
| North East Lincolnshire |
34.7 |
47.0 |
| St. Helens |
34.6 |
36.0 |
There is a link between those worse affected by COVID-19 living in areas with high deprivation. People in deprived areas are more likely to suffer negative impacts of the pandemic than those in less deprived areas, with knock-on socio-economic effects and higher COVID-19 mortality rates.
We compared the COVID-19 based grants data with Indices of Deprivation to see whether areas with high levels of deprivation are being targeted.
17 of the 20% most deprived Local Authorities are receiving high levels of COVID-19 specific grant funding. Six of these are based in London: Hackney, Tower Hamlets, Islington, Haringey, Lambeth and Southwark. But the picture is varied, some Local Authorities with high deprivation have received less grant funding during the pandemic. Four of the 20% most deprived Local Authorities received minimal grant funding (grants issued in the bottom 20% quintile): Southampton, Tendring, Ashfield and Thanet.
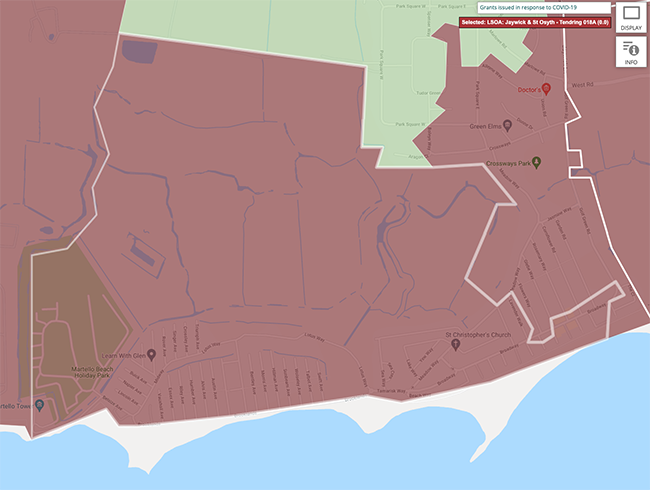
When looking at a more granular level, we can see here the most deprived LSOA, Jaywick & St Osyth, has 0 grants issued in response to COVID-19. There may, therefore, be unmet need in this neighbourhood during the pandemic. Though it is important to note that Jaywick & St Osyth may have benefited from grants to organisations located elsewhere but operating in the area (as many of the grants in the dataset are based on the location of organisations receiving funding rather than beneficiaries of the funding). 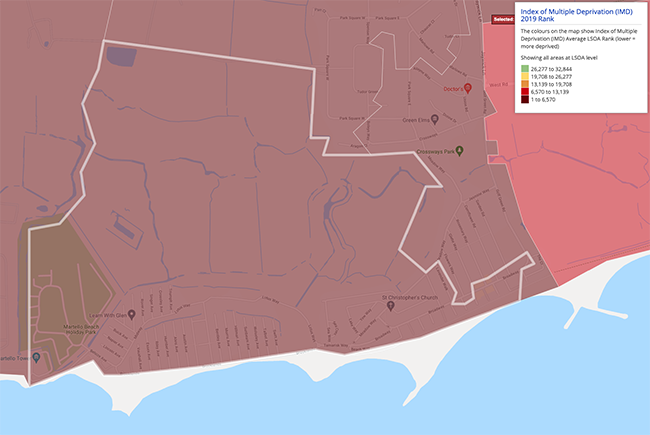
The Community Needs Index identifies areas experiencing poor community and civic infrastructure, relative isolation and low levels of participation in communities. Areas with high community need are more likely to have greater challenges arising from the impact of COVID-19, particularly in terms of isolation and access.
We identified the top 20 Local Authorities which have the highest Community Needs scores and compared them with the proportion of grants issued in response to COVID-19 within these areas.
We can see that some areas in the North East: Hartlepool, Sunderland and County Durham, have been identified as having high community needs and have had more grant activity related to the COVID-19 response.Three local authorities in Essex are scored as having high levels of community needs, yet have so far been issued a low proportion of grants in response to COVID-19 (grants issued in the bottom 20% quintile): Castle Point, Tendring and Basildon.
| Local Authority | Community Needs score | Total grants issued in response to COVID-19 (per 100,000 population) |
| Castle Point |
162.80 |
8.9 |
| Tendring |
149.46 |
14.3 |
| Basildon |
143.14 |
16.6 |
|
Halton |
132.66 |
24.0 |
|
Wakefield |
130.00 |
25.0 |
|
Doncaster |
129.51 |
29.8 |
|
Redditch |
128.85 |
21.1 |
| Cannock Chase |
128.64 |
14.9 |
|
Newcastle-under-Lyme |
125.52 |
25.5 |
| Knowsley |
122.39 |
32.5 |
| Hartlepool |
120.47 |
67.3 |
| Sunderland |
119.66 |
62.7 |
| Tameside |
118.84 |
25.2 |
| Rochford |
115.50 |
19.5 |
| Barnsley |
115.30 |
30.0 |
| Great Yarmouth |
115.25 |
32.2 |
| County Durham |
112.24 |
60.4 |
| Kingston upon Hull, City of |
110.58 |
58.5 |
| South Staffordshire |
110.50 |
24.0 |
| Corby |
109.13 |
23.5 |
A subscription to Local Insight gives you instant access to more than 1000 local level datasets (including the new Grants in response to COVID-19 indicator and the COVID-19 Vulnerability Index). 
You can create any bespoke areas that you like, from wards and parishes to GP localities and service catchment areas. All of the data is aggregated to these areas, ready for you to explore through maps, dashboard and reports.
Local Insight is designed to be easy to use & intuitive – so you don’t need to be a statistician to find the contextual information about the communities you work with.
If you’d like to find out more about how a subscription could work for you, please give us a call on 01273 810270 or sign up for a demo and one of our team will be in touch.

The English Community Needs Index (CNI) 2023 is now published as open…
More
Social housing providers have deep, experience-based knowledge of the communities they serve….
More
Many funding programmes use the Index of Multiple Deprivation (IMD) to identify…
More


