
Climate Change has become an ever more pressing global issue, demanding far more dramatic and immediate action than ever before. This is especially pertinent given the latest report from the Intergovernmental Panel on Climate Change (IPCC). They warn that unless deep reductions in carbon dioxide (CO2) and other greenhouse gas emissions occur in the coming decades, global warming of 1.5°C and 2°C will be exceeded during the 21st Century. We have seen many governments taking action in strategy. The UK has set an ambitious target to slash carbon emissions by 78% by 2035 and reach net-zero by 2050. Having access to key datasets and information is imperative for strategy and planning in any global effort, or local effort, to reduce carbon emissions. That is why we have added a new dataset to Local Insight, the ‘Total carbon footprint per person (kg)’.
What is a Carbon Footprint?
Anthropogenic climate change is caused by the release of gases into the atmosphere which are too great for the earth to absorb by natural processes. The accumulation of these gases in the atmosphere traps heat – causing a greenhouse effect – which results in a rise of the global temperature. Carbon dioxide is the most significant greenhouse gas that contributes to global warming, so it is imperative that we reduce carbon emissions. A carbon footprint captures the amount of carbon dioxide released into the atmosphere as a result of different activities, e.g. driving, flying or heating your home. There is no definitive way to measure carbon footprints and many approaches exist.
The place-based carbon footprint
The new dataset in Insight is from the Place-Based Carbon Calculator, an open source interactive tool that estimates the per-person carbon footprint at small-area level (LSOA). The carbon footprint data is an attempt to create a localised and place-based approach to calculating carbon footprints. It aims to ‘provide an informative local footprint that can aid in policy making and communicating complex ideas to the public.’ It is an easy way to understand carbon footprints and compare them across different areas. It is a consumption-based approach to carbon footprints that measures emissions in the context of the consumer, not the producer. The data shows the total carbon footprint per person (in kg of carbon dioxide equivalent) based on several categories of consumption: electricity, gas, other heating, car and/or van driving, flying and consumption of goods and services, which all combine into a total carbon footprint value. This produces a total carbon footprint divided by the number of people living in an area. Where local data may not be as easily available it relies on surveys and modelling for other types of consumption such as food.
Limitations
There are certain limitations to this data:
The southeast region has a larger cumulative carbon footprint per person. And five local authorities in Surrey county have high carbon footprints. This is likely due to high levels of transport emissions combined with domestic energy consumption.
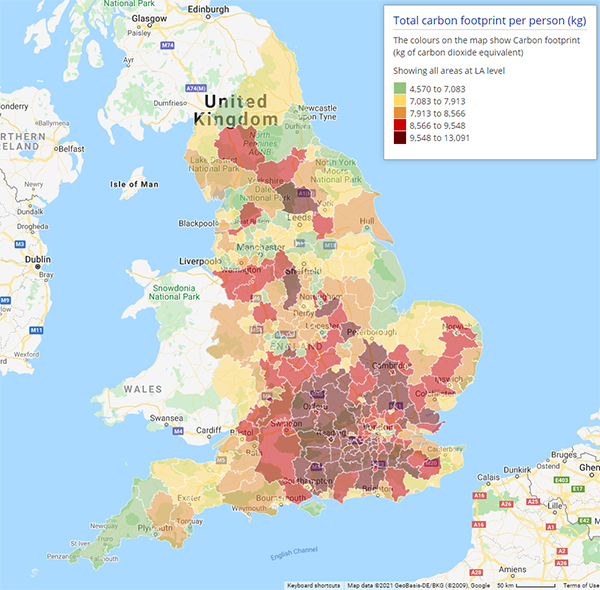
Large expensive housing produces high emissions and the residents have little incentive to change their habits – energy bills are not a challenge to meet and government initiatives such as the Green Homes Grant are targeted at lower income households.
| LA | Region | Total carbon footprint per person (kg of carbon dioxide equivalent) |
|---|---|---|
| Wokingham | South East | 12724 |
| Hart | South East | 12588 |
| Surrey Heath | South East | 12468 |
| Waverley | South East | 12410 |
| Elmbridge | South East | 12399 |
| South Oxfordshire | South East | 12273 |
| Mole Valle | South East | 11831 |
| Woking | South East | 11821 |
| Richmond upon Thames | London | 11807 |
| West Berkshire | South East | 11718 |
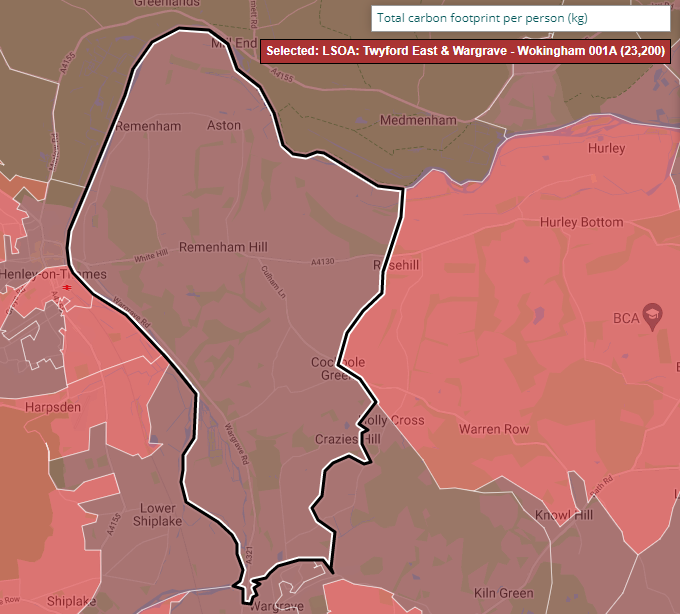
The data is published at LSOA level, we can view this geography on our Insight map too. The LSOA pictured below has a high carbon footprint per person (23,200kg). This is within the Twyford ward on the outskirts of Wokingham. Using this information we can postulate underlying factors in areas with high carbon footprints. We can use this data with other datasets we hold on Insight.
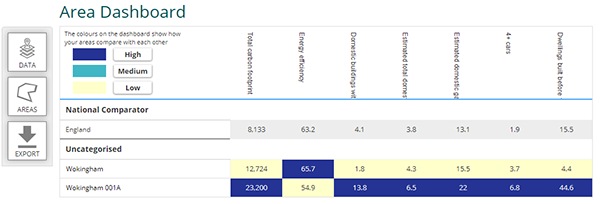
We created a custom dashboard to easily compare the new carbon footprint indicator with other indicators we have on Insight. Here it is easy to see underlying factors related to a high carbon footprint in this area and compare it with other areas. We have compared this indicator to data on energy efficiency and consumption, vehicle ownership and dwelling stock. This area has high levels of energy consumption coupled with relatively poor energy efficiency scores. Less than half of the dwelling stock in this area was built before 1900. These historic homes tend to be inherently energy inefficient too. There is also a high proportion of households in this neighbourhood owning more than one vehicle.
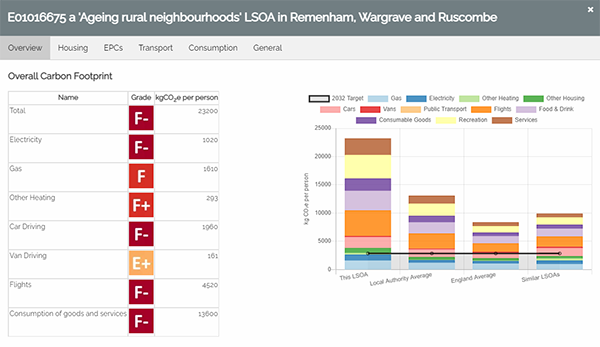
You can also view each LSOA on the PBCC interactive tool which provides a breakdown of categories that contribute towards the total carbon footprint. Below we see that this LSOA scores poorly on all underlying consumption categories.
As mentioned above this dataset works well when used with other datasets.
Some datasets in Insight could be complementary to this indicator:
Energy efficiency data
We have updated data on energy efficiency derived from Energy Performance Certificates (EPC). Approximately 40% of the UK’s energy consumption and carbon emissions arise from how we heat and use our buildings. Data on energy efficiency can help inform how to better reduce energy consumption and carbon emissions.
Other relevant indicators:
You can also add your own custom datasets to compare with this using the Upload Your Own Data tool.
A subscription to Local Insight gives you instant access to more than 1000 local level datasets (including the new Total carbon footprint per person (kg) indicator).
You can create any bespoke areas that you like, from wards and parishes to GP localities and service catchment areas. All of the data is aggregated to these areas, ready for you to explore through maps, dashboard and reports.
Local Insight is designed to be easy to use & intuitive – so you don’t need to be a statistician to find the contextual information about the communities you work with.
If you’d like to find out more about how a subscription could work for you, please give us a call on 01273 810270 or sign up for a demo and one of our team will be in touch.

The English Community Needs Index (CNI) 2023 is now published as open…
More
Social housing providers have deep, experience-based knowledge of the communities they serve….
More
Many funding programmes use the Index of Multiple Deprivation (IMD) to identify…
More


