
Understanding levels of connectivity between different places is essential to understanding how some areas are performing less well than others and plays a considerable role in informing investment decisions and identifying areas that may be hindered by weaker transport links. This is important as poor connectivity may be holding back parts of the UK – particularly in terms of access to the labour market. However, measuring relative connectivity has been less straightforward, and access to granular data has generally been scarce.
A new measure of connectivity that focuses on job accessibility created by UK Onward seeks to address this gap in the data landscape.
The data differs from current measures of connectivity that focus on solely direct travel time, which excludes the whole journey picture. Instead, this dataset incorporates a ‘door-to-workplace’ measure. The new measure includes every stage of the journey, from time spent walking to the mode of transport (car, driving, parking – or walking to the workplace) and average delays, timetabling, and journey time on public transport. It also takes into account the effective size of the labour market. Previously, other measures have defined connectivity by a threshold – the journey time to the nearest centre of employment of 5,000 or more jobs, which treats different places as similar. Instead, this dataset measures the total number of jobs accessible within different time horizons.
The data presents an overall Job access score, the weighted average job count that combines driving and public transport. It focuses on the number of jobs reachable by car and public transport from every LSOA in the country against different time horizons, which gives a more comprehensive measure of connectivity and the relative labour market size between different areas. The data and research have found that the connectivity of towns relative to cities may have previously been overstated and that some outer regions may have less efficient transport connectivity than thought.
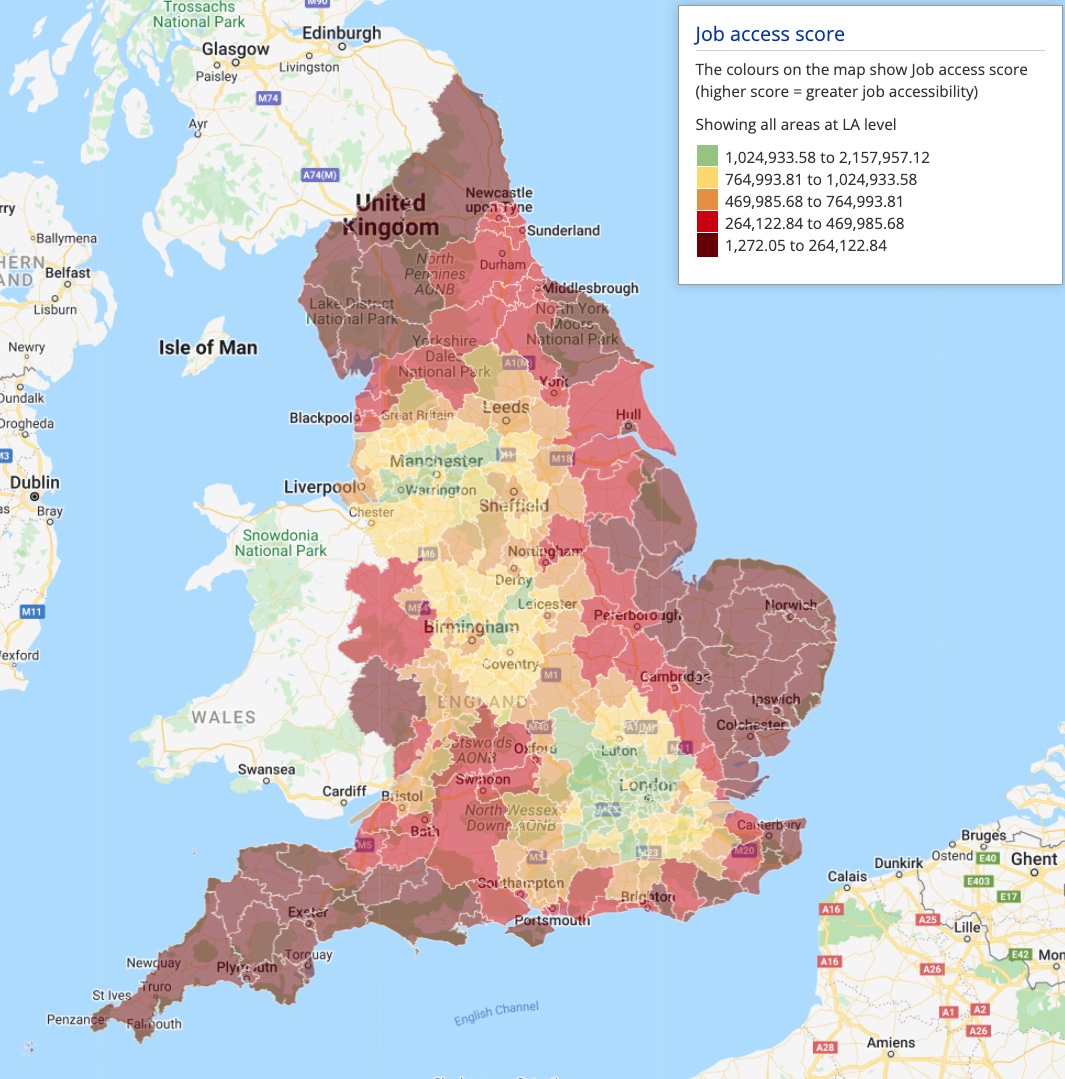
As one would expect, the large conurbations in and around London, Manchester, and parts of the Midlands have better access to jobs, being large economic centres with more efficient transport links. Those in close proximity to London, where they can access more jobs, score highly on this measure – areas such as Bracknell Forest, Slough and within Surrey and Hertfordshire. We also see areas within West Yorkshire with higher scores. Urban areas surrounding Manchester, Leeds and Liverpool, which have high jobs density, also score better, where they see high jobs density with favourable intra-transport networks. However, across the country, the outer regions of these cities are much more limited in terms of job accessibility.
In isolated centres such as Newcastle, the picture is notably different – where the city and surrounding areas score relatively poorly on this measure. This is particularly important to note given that Newcastle has a relatively higher jobs density – but lack of access to transport links means that poorer access to jobs may hold the city back.
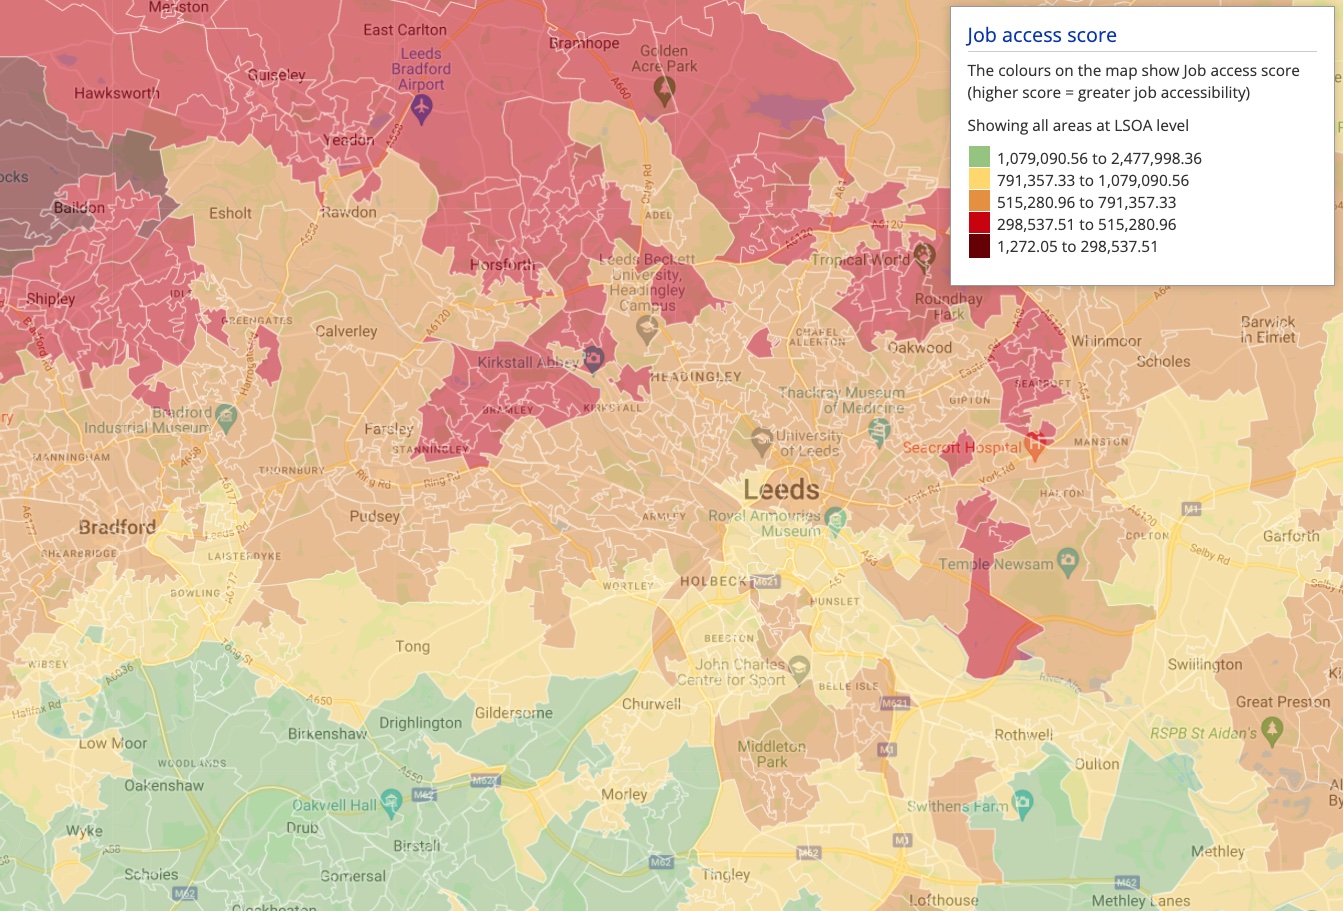
At a granular level, we can see some of the disparities in more detail. As the data indicates, the peripheral areas of these expectedly connected cities appear not to be as well connected to jobs – and this may be indicative of suboptimal public transport networks in some of the country’s largest regional cities.
For example, in the peripheral areas surrounding major cities like Leeds and Bradford, we see lower scores on this measure. Below we can see the indicator mapped at LSOA level. Leeds – which has a relatively high jobs density, and one of the major economic centres, performs less well in terms of job access – and the peripheral areas, particularly to the North West of the City, have comparatively poorer job accessibility.
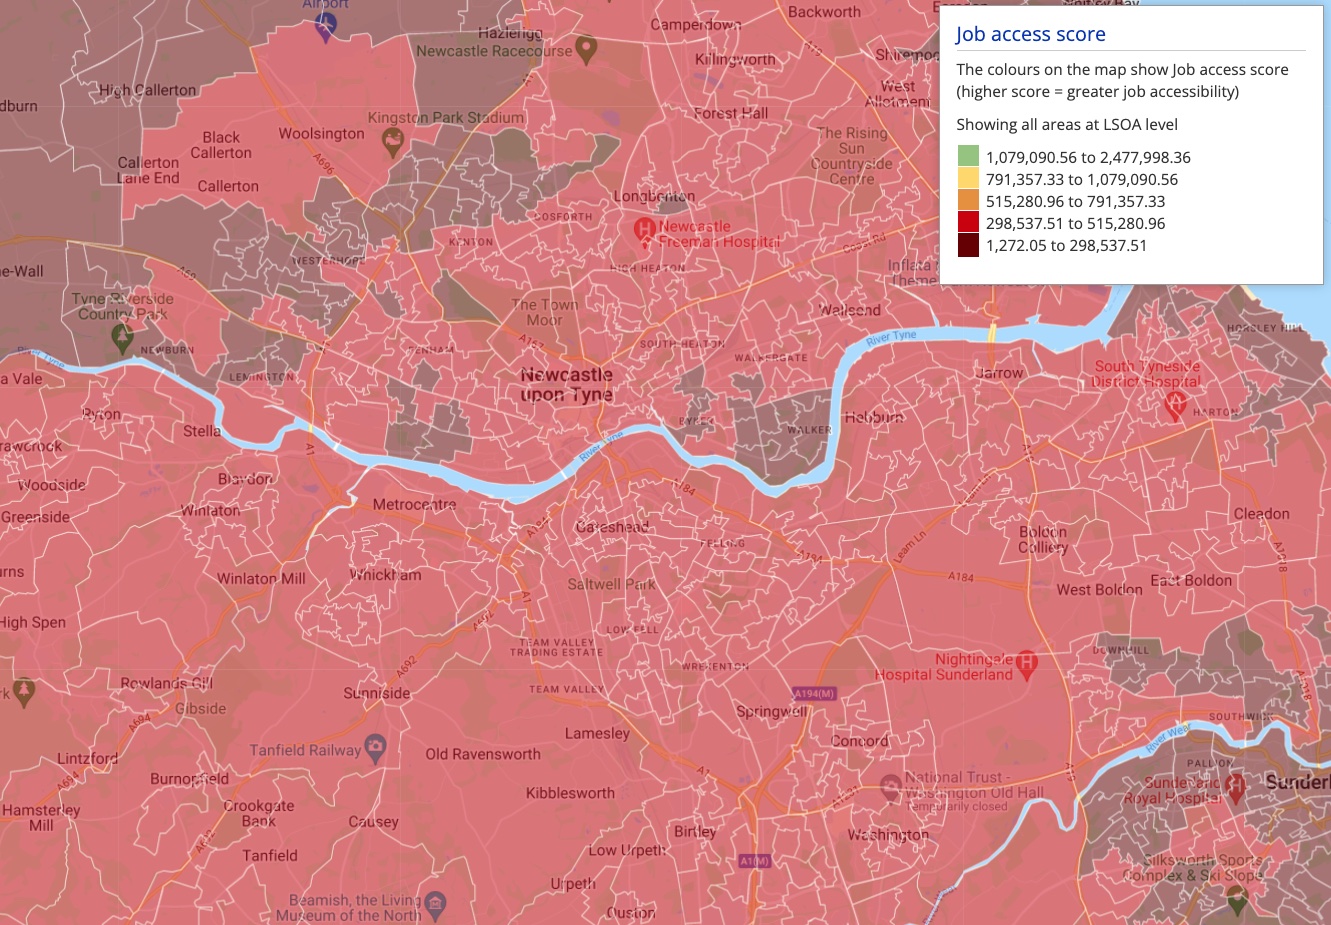
Newcastle, which also scores relatively poorly to its counterparts – particularly in the peripheral areas in the northwest, indicates poorer levels of connectivity. There is a pattern of suboptimal connectivity across towns in the peripheries of northern cities.
Overall, the data provides an alternative understanding on connectivity and highlights that some transport networks need to be improved, particularly in the intra-city networks of some regional cities and towns.
Job accessibility is still, however, a multifaceted issue. There is much more to labour market access than connectivity, where education, skills, and income still act as barriers to access.
We also have other relevant indicators on Local Insight that may be of interest and could be complementary to this indicator:
A subscription to Local Insight gives you instant access to more than 1000 local level datasets (including the new Job access score indicator).

The English Community Needs Index (CNI) 2023 is now published as open…
More
Social housing providers have deep, experience-based knowledge of the communities they serve….
More
Many funding programmes use the Index of Multiple Deprivation (IMD) to identify…
More


