
The census is one of the most important data releases for policymakers across central government and local government. It gives us the fullest and most robust picture of all the people and households across England and Wales. The results from Census 2021 will be used to inform decisions around targeting and funding key public services, including transport, education and healthcare. So it is no surprise that local authorities are keen to share analysis of the data for colleagues across the council, strategic partners and residents. So how do councils present Census 2021 data?
We have been doing some digging into each council’s data analysis for Census 2021 so far, and have collated what we have found in one document, as well as looking at the different ways organisations present their data.
With small area data releases due to be published in stages across autumn, we are also thinking about the different ways we can present the data through Local Insight, to support organisations in their analysis internally and presenting externally.
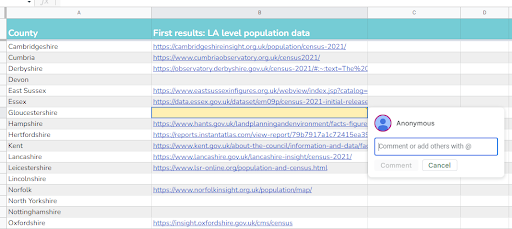
We have put together a document that links to Census 2021 analysis from each county, unitary, metropolitan borough, London borough and district across England, where available.
We would love to fill some of the gaps, so if we have missed something and you can provide a link to your council’s analysis – please do! Simply find your local authority in the document and add a comment with a link to the appropriate web page.
As small-area data is released and more analysis is made available, we will update the document to create a central resource of all Census 2021 analysis from councils.
Analysis of Census 2021 data has come in all shapes and sizes so far. Generally, most cover headline statistics about local areas, combining text commentary with supporting charts and data visualisations, including:
Many councils have produced data briefings following the Census 2021 local authority level data release. These are produced in different formats such as:
Many councils have online data portals, where Census 2021 data is available to explore through interactive tables, charts and maps.
Organisations use platforms such as Tableau or Microsoft BI to create their own visualisations (like Leicestershire), or use an out-of-the-box solution, such as our own Local Insight, like Bedford.
Some councils have put together infographics with the key figures about their local area (often complemented with more in-depth analysis as part of a data briefing). For example, Derbyshire Council has produced infographics for each of its constituent districts.
While it was exciting to see the first outputs on population from Census 2021, the topic summary data (due to be published over autumn and winter 2022) will provide rich data on many more topics at a more granular level.
Local Insight is set up to take the pain out of data collection and processing – leaving you with more time to focus on your analysis and sharing the key stories with your stakeholders.
We manage and maintain all the data in the system and aim to have new census data available within a couple of days of release (the local authority level data was available to use in Local Insight on the same day as publication).
Our flexible area creation means you can create any geography you care about quickly and easily within the tool. Census data (as well as the 1100 other datasets we hold), will instantly be aggregated to your custom areas – meaning you can have Census 2021 data at your fingertips for wards, parishes, and GP localities with very little input from you.
If this sounds like it will help with your analysis of Census 2021 data, talk to us about a demo and free trial.

The English Community Needs Index (CNI) 2023 is now published as open…
More
Social housing providers have deep, experience-based knowledge of the communities they serve….
More
Many funding programmes use the Index of Multiple Deprivation (IMD) to identify…
More


