Floods are a significant concern in agriculture, civil engineering and public health. They are often caused by human changes to the environment, such as deforestation and removal of wetlands, changes in waterway course and larger environmental issues such as climate change and rising sea levels. Flood risk management is necessary to help reduce the risk of flooding and, in turn, lower the possibility of impact to agricultural operations, damage and disruption to infrastructure and health impacts such as drowning, injuries and hypothermia.
A report published in 2017 aimed to develop a better understanding of the relationship between social vulnerability and exposure to flood risk across different areas. This is essential in order for Lead Local Flood Authorities (LLFA) to deliver a socially just approach to prioritising neighbourhood flood risk management. This is why we have added a new dataset to Local Insight, the ‘Neighbourhood Flood Vulnerability Index (NFVI)’.
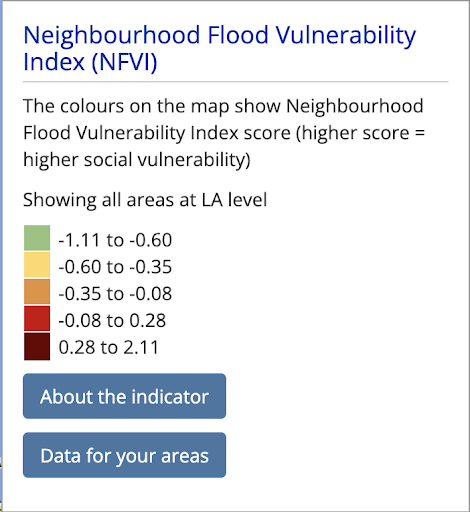
The NFVI measures the social vulnerability of a neighbourhood should a flood occur. As such, this dataset does not explicitly reflect areas that are most at risk of flooding, but instead combines five characteristics which indicate individual sensitivity before, during and after a flood:
For more information about this tool please see: Mapping tool page | Climate Just
One limitation of this dataset is that it is a one-off publication from June 2017. With only one snapshot of flood vulnerability from 5 years ago, this fairly old dataset may not accurately reflect neighbourhood flood vulnerability in 2022 and doesn’t allow us to compare differences in vulnerability over time.
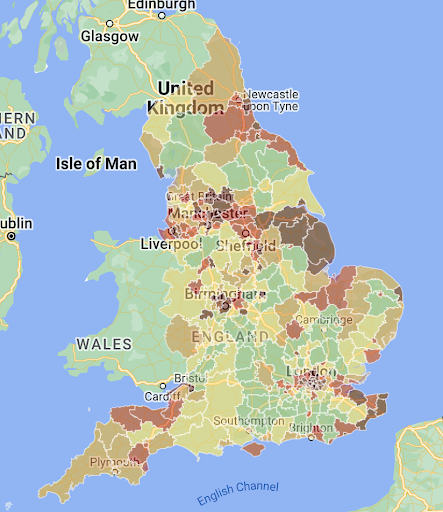
The NFVI shows that there is higher flood vulnerability in local authorities on the East coast, specifically in the county of Lincolnshire. There is also high flood vulnerability in local authorities which encompass cities – London, Bristol, Coventry, Birmingham, Liverpool, Manchester and Sunderland. This is likely due to an over-representation of urban areas, which are are prone to flooding for 2 reasons:
However, neighbourhood factors such as income, physical mobility and social networks can also influence the characteristics of vulnerability.
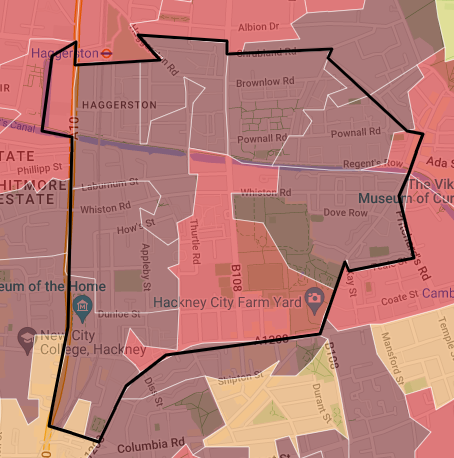
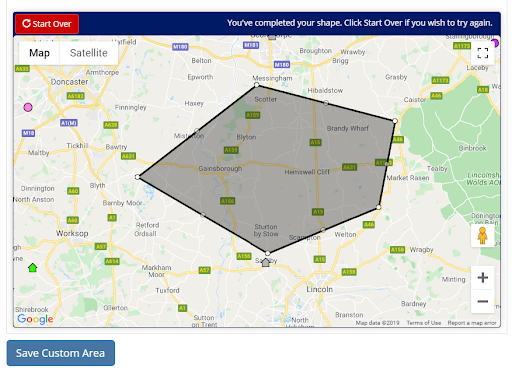
Although this dataset was published at LSOA level, Local Insight can be used to create and compare custom areas on the NFVI. The electoral ward pictured below (Haggerston) has a high score on the NFVI (1.15), indicating a high social vulnerability should a flood occur. This ward is within the London borough of Hackney. Using this information combined with other datasets we hold on Local Insight we can postulate underlying factors in areas with high flood vulnerability.
Creating a custom dashboard on Local Insight, we can easily compare the new NFVI indicator with other indicators we have on Local Insight, as well as comparing different electoral wards. Here we have compared an electoral ward in Hackney (Haggerston) to a ward in Bath and North East Somerset (Timsbury) to see whether they differ on indicators which impact the ability to prepare, respond and recover from a flood – income, physical inactivity and social networks – with this potentially explaining their disparity on the NFVI. These areas were chosen due to their difference in urban/rural classification, with Haggerston’s highly dense and relatively young population contrasting the rural characteristics of Timsbury. We can see that, compared to a ward with a low social vulnerability to flooding, Haggerston has a lower average income and a higher proportion of physically inactive adults. These factors may therefore contribute to the difference in NFVI scores between urban and rural areas.
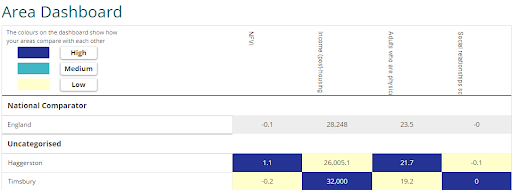
We also compared these two areas on their Local Social Relationships average score to see whether a difference in social networks could partially explain Haggerston’s higher flood vulnerability. On this measure, a negative score indicates weaker local relationships. As shown below, Haggerston scores less than 0 on this measure, demonstrating weaker social networks than both Timsbury and the national average.
As mentioned above, this dataset works well when used with other datasets. There are many datasets in Local Insight which complement the information that was initially used to generate each vulnerability indicator in the original report, drawing upon the characteristics of susceptibility, ability to prepare, respond and recover, and community support:
You can also add your own custom datasets to compare with this using the Upload Your Own Data tool.
A subscription to Local Insight gives you instant access to more than 1000 local level datasets (including the new Neighbourhood Flood Vulnerability Index (NFVI)).
You can create any bespoke areas that you like, from wards and parishes to GP localities and service catchment areas. All of the data is aggregated to these areas, ready for you to explore through maps, dashboard and reports.
Local Insight is designed to be easy to use & intuitive – so you don’t need to be a statistician to find the contextual information about the communities you work with.
If you’d like to find out more about how a subscription could work for you, sign up for a demo and one of our team will be in touch.
What is UKGrantmaking? UKGrantmaking is a landmark publication on the state of…
More
The Marmot Review, published back in 2010, still has important implications today…
More
We are proud to announce that we have successfully redeveloped and launched…
More