Social housing providers have deep, experience-based knowledge of the communities they serve. This understanding is built through long-term relationships, frontline experience and local engagement.
Alongside this, there is also a need to:
Place-based data and insight can play an important role in backing up local knowledge and communicating local context to your stakeholders. Place-based intelligence for social housing provides a structured way to combine local expertise with robust evidence, helping organisations make more informed and transparent decisions.
This guide sets out common place-based decisions made by housing providers, and how data and insight can support you to:
You can also download a companion guide covering the datasets most commonly used by housing providers to support these decisions.
This usually starts with bringing together your housing stock data, primarily property locations – and linking it to small-area geographies (for example LSOAs or Data Zones). This creates a consistent baseline that allows every property to be understood in relation to its surrounding area.
In reality, organisations work with all types of boundaries; housing estates, project and programme areas and housing officer patches. So, a useful approach is to use statistical geographies (like LSOAs), when there is a need for consistency and comparison but also adapt these to reflect how your stock and communities are distributed.
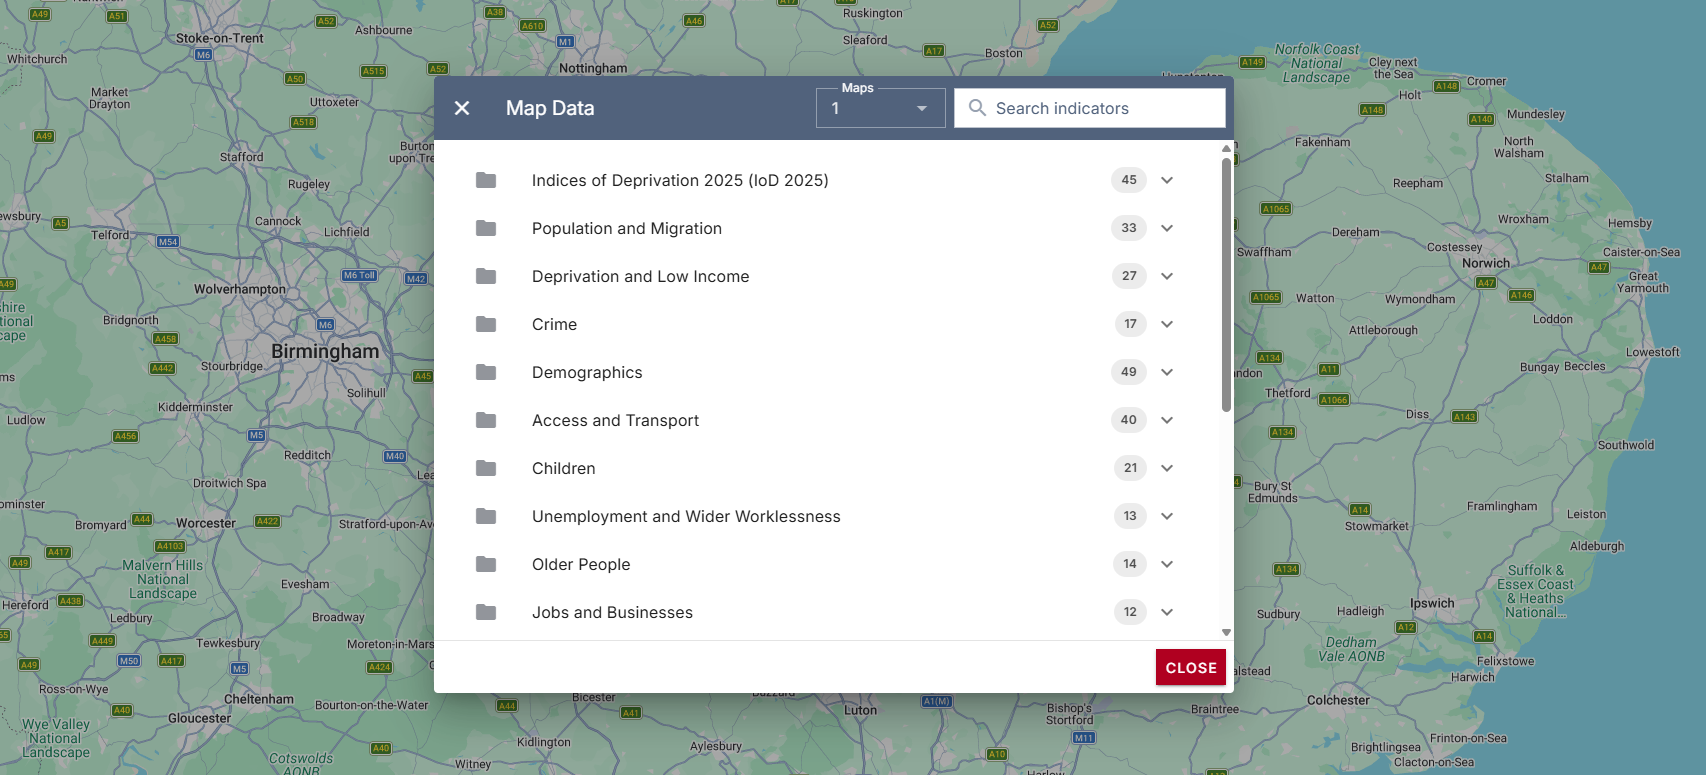
From there, you can explore data covering themes such as deprivation, health, demographics and employment. Through covering a broad range of data you can build a consistent view across all neighbourhoods, so that each area can be understood and compared in the same way, making it easier to highlight the differences and nuances between areas.
This is often structured into a set of standard area profiles or dashboards, which bring together key indicators for each neighbourhood. Over time, you can refine this into a core set of measures that are used consistently across your footprint, allowing you to move beyond one-off analysis towards a more repeatable and shared understanding of place. This approach creates a foundation for place-based intelligence for social housing, enabling organisations to understand both their homes and the wider communities in which they sit.
A good place to start is mapping your housing stock against existing administrative geographies, such as wards. This provides an initial sense of how well current neighbourhood definitions align with where homes are actually located, and where there may be mismatches, particularly in areas where stock is more dispersed or there are clearly defined estates.
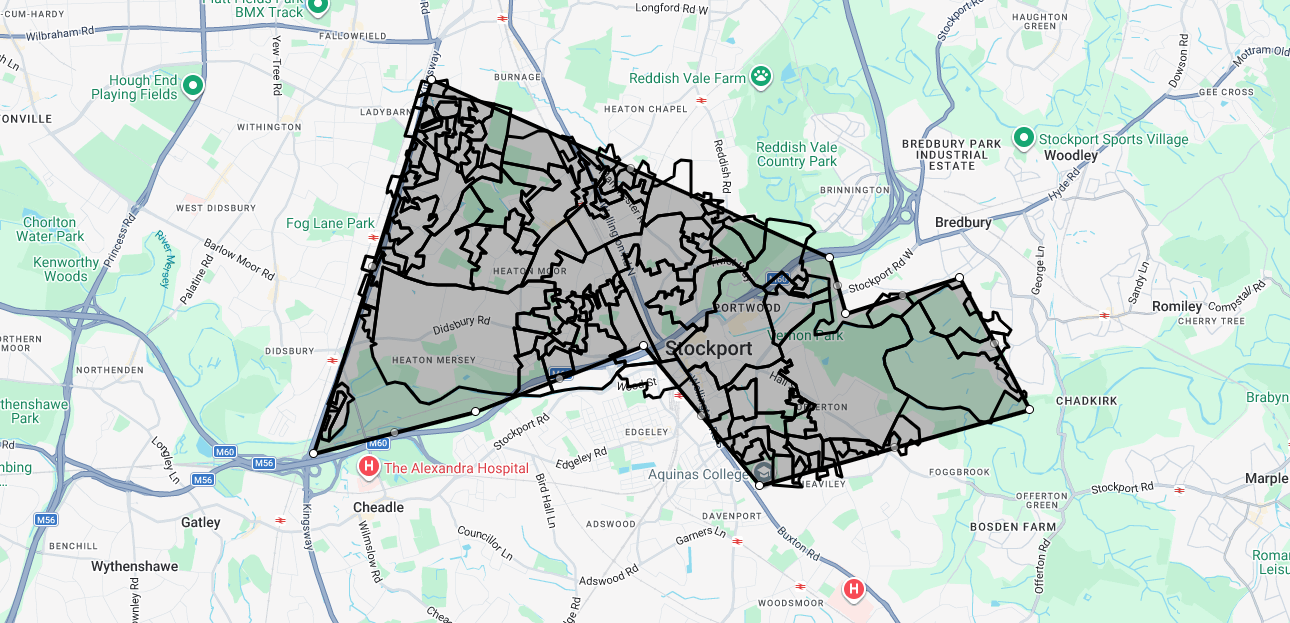
From there, you can experiment with alternative approaches to defining neighbourhoods. This might involve grouping smaller areas together in different ways and comparing how these potential neighbourhoods look in terms of population size, levels of need, and overall coherence. The aim is not just to create boundaries that work operationally, but to ensure that each neighbourhood represents a meaningful and comparable area.
As this process develops, you can sense-check and refine these groupings using data, helping to identify where boundaries may be combining areas with very different characteristics, or where a different configuration would better reflect how communities function in practice. Over time, this can lead to a more consistent and transparent neighbourhood model that is grounded in both housing distribution and local context.
It is useful to begin by identifying a small number of priority themes that reflect your strategic objectives, for example health, employment, financial inclusion or community safety. These themes provide a structure for bringing together different types of data in a way that reflects the outcomes you are trying to influence.
You can then compare your neighbourhoods using a consistent set of indicators to build up a picture of relative need. Rather than relying on a single measure, use a range of indicators to see how different issues combine within the same place. This can help to highlight areas where multiple challenges are present, and where a more targeted or coordinated response may be needed.
Local knowledge and organisational context is very important here — including factors such as the concentration of housing stock, existing services, and current areas of activity. This ensures that prioritisation decisions are supported by a combination of data and experience rather than either in isolation.
Understanding local need can provide direction on the types of interventions that will be most relevant to residents (for example, high unemployment rates could point towards a pre-employment programme).
However it is important not to blindly follow the data and ensure that prioritisation decisions reflect the make-up of your residents. For example, if the data for a neighbourhood shows high levels of NEETs (Not in Education, Employment or Training) but all your residents in that neighbourhood are pensioners, an apprenticeship programme may not be the most relevant choice. Effective place-based intelligence for social housing combines quantitative evidence with resident knowledge and operational insight to ensure interventions are targeted appropriately.
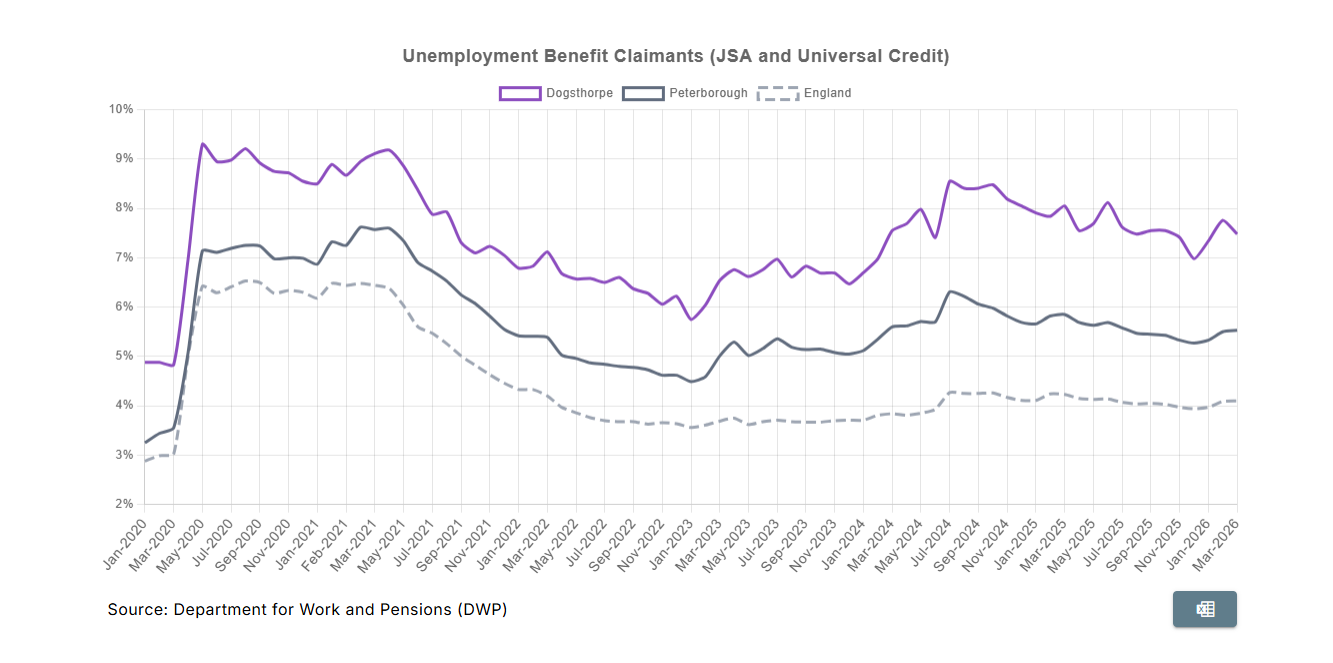
This decision involves moving from presenting large volumes of data towards building a clear and coherent narrative that explains why an area has been prioritised, using data to support that story. For example, it is helpful to include comparisons to relevant local and national benchmarks, helping to show how it differs from other places and why additional investment may be justified.
You can do this through developing concise area profiles or evidence summaries that combine recognisable measures covering deprivation, health, employment and demographics, alongside relevant context.
Make sure to tailor the outputs to your intended audience. This could mean focusing on the most relevant indicators rather than the technical detail and including clear, easy to understand visualisations. Maps are often an easy way to show variation of need across places in a visual way.
It is common to find that different teams are working from slightly different versions of the same data, using their own sources, definitions or methods of analysis. This can lead to inconsistencies in how places are understood and discussed across the organisation.
To address this, it’s useful to define a single source of truth across your organisation. Typically this is achieved through defining a core set of datasets and indicators that are used consistently across teams. Access to this information is then centralised, making it easier for different functions to work from the same evidence base rather than recreating analysis independently.x
We also recommend introducing light guidance or frameworks to support consistent use, helping to ensure that insight is applied in a similar way across different teams and contexts.
In practice, this often builds on the same foundation established in earlier work — using a consistent set of indicators to revisit and compare areas over time. Rather than carrying out one-off analysis, you can begin to take a more repeatable approach, periodically refreshing data and reviewing how neighbourhoods are changing relative to one another.
This allows trends to be identified not just within individual areas, but across the wider footprint. For example, some neighbourhoods may be improving while others remain stable or show signs of increasing pressure. Looking at change in a comparative way can help to highlight where priorities may need to shift, rather than relying solely on static snapshots of need.
Over time, this can become part of a regular cycle of review and provide more consistent awareness of how communities are evolving.
How do we understand where other social housing providers operate, and what this means for our organisation?
You could begin by mapping your own housing stock alongside that of other providers, using available datasets such as the Regulator of Social Housing and Land Registry. This helps to build a clearer picture of where there is overlap, where provision is more concentrated, and where organisations are operating in similar or distinct areas.
From there, you can begin to explore how these patterns relate to local context — for example, whether areas with multiple providers also show higher levels of need, or whether there are opportunities to better align activity across organisations. This may involve comparing neighbourhood characteristics, understanding how different providers’ stock is distributed, and identifying areas where services or investment could be coordinated more effectively.
Over time, this type of analysis can support more strategic conversations, for example around partnership working, shared services, or potential acquisitions, by providing a clearer, evidence-based view of how organisations operate within the same places and how their portfolios relate to one another.
Who are the local organisations we can work with, and where are gaps in provision?
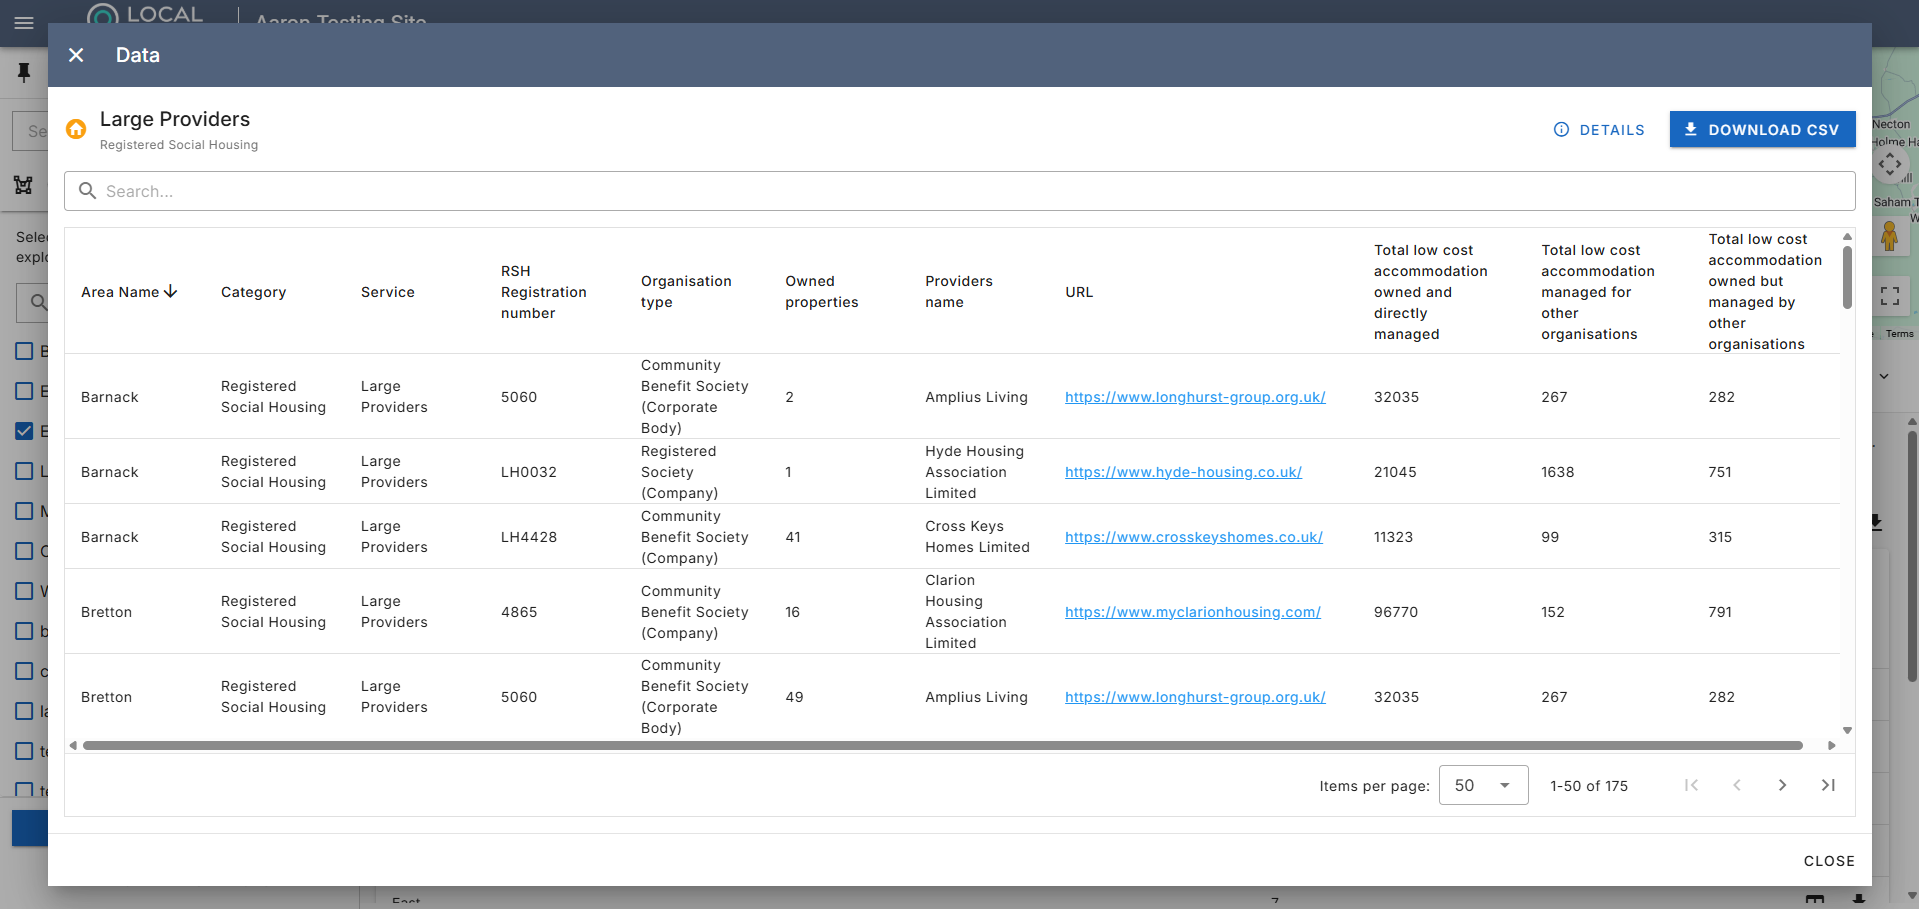
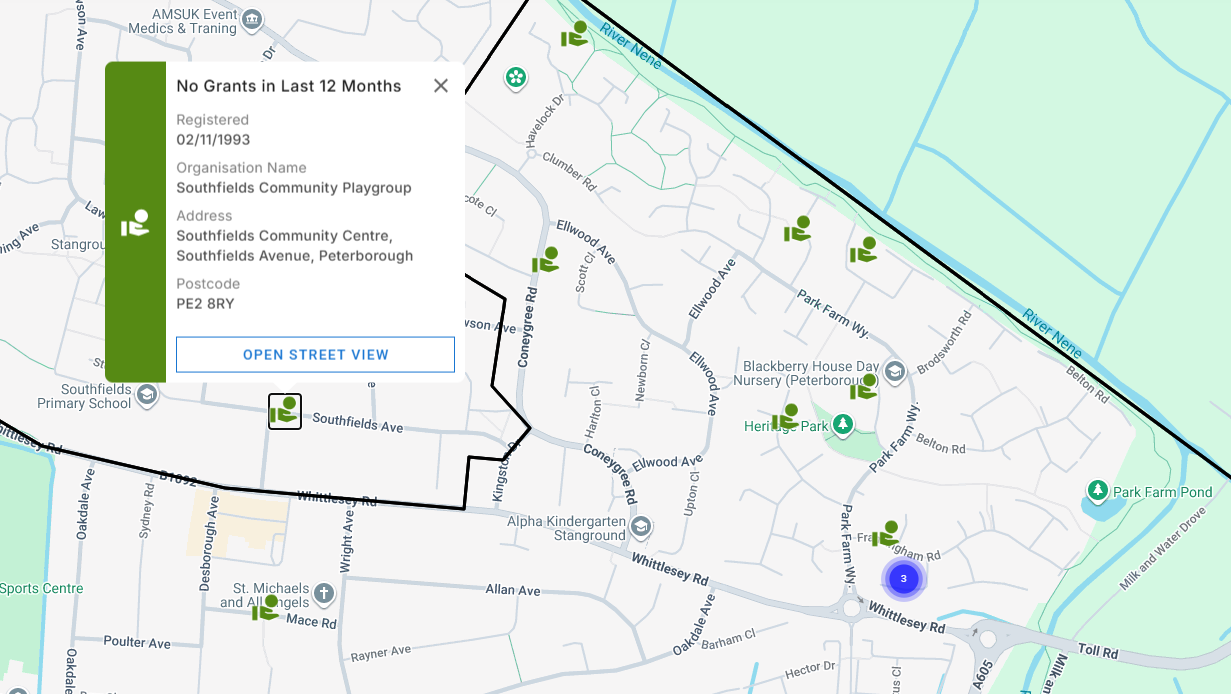
This typically begins by bringing together information on the organisations and services operating within a local area. This might include voluntary and community sector organisations, public services, and other community assets that play a role in supporting residents.
In practice, this information is often held across multiple sources — such as internal knowledge, spreadsheets, or separate directories — and may not always be brought together in a consistent way. By mapping these organisations spatially alongside your housing stock and wider contextual data, you can begin to build a clearer picture of how services are distributed across different areas.
From there, it becomes possible to explore how the availability of services relates to levels of need. For example, you may identify areas where there are relatively high levels of need but fewer local organisations or services, as well as areas where provision is more concentrated. This helps to highlight both gaps and opportunities for collaboration.
Over time, this approach can support a more joined-up understanding of local ecosystems, enabling you to move beyond ad hoc stakeholder mapping towards a more consistent and reusable view of the organisations operating in each place.
How do we understand where our community investment is going, and whether it is equitable?
A useful starting point is to bring together data on where community investment has been directed, such as funding, programme delivery or other forms of local spend. This information is often held internally and may typically be reviewed at an area level, for example by neighbourhood or ward.
However, when viewed in isolation, this can sometimes give a misleading picture. Areas with higher levels of investment may appear to be receiving disproportionate funding, when in practice this may reflect a higher concentration of housing stock or residents in that location.
To address this, it can be helpful to link investment data to your housing stock, allowing you to understand how resources are distributed relative to the number of properties or residents in each area. This provides a more comparable view, moving beyond total investment values to measures such as investment per property or per resident.
By looking at investment in this way, you can begin to explore how fairly resources are being allocated across your footprint. This may highlight that areas with lower overall spend are receiving a similar level of investment when adjusted for stock, or conversely identify places where there may be genuine gaps in provision.
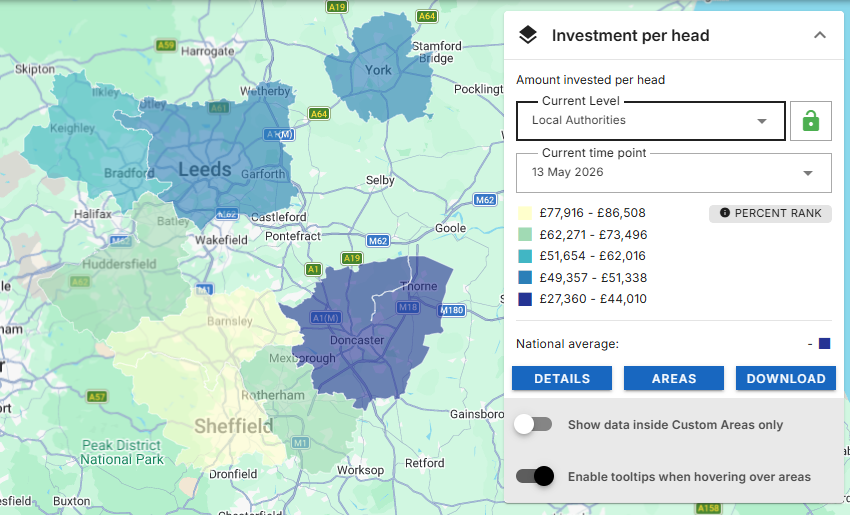
Over time, this approach can support more transparent and evidence-based conversations, particularly when explaining decisions to residents and stakeholders. By clearly showing how investment relates to both need and the distribution of housing stock, organisations are better able to demonstrate that resources are being allocated in a fair and consistent way.
Many social housing organisations are continuing to develop how they use place-based insight in practice – moving from one-off analysis towards more embedded and repeatable approaches. As place-based intelligence for social housing matures, organisations are increasingly able to connect strategic planning, operational delivery and community investment through a common evidence base.
If you are reviewing your current approach, useful starting points may include:
In practice, bringing together these different datasets, maintaining consistency across areas, and making insight accessible to a wide range of teams can be challenging.
Some organisations address this by developing internal tools and processes. Others use dedicated platforms to bring together housing data and place-based insight in a single, consistent view.
Local Insight is one example of this approach, used by housing providers to:
If you would like to explore how Local Insight can support your place-based decision making, book a demo with the team.
P.S. Download our companion guide covering the most common datasets that are already being used by housing providers to support these decisions.
With thanks to Paul Moralee and team at Karbon Homes and Charlie Hargreaves at Wates for sharing their insights and experiences, which helped inform and validate the content of this guide.

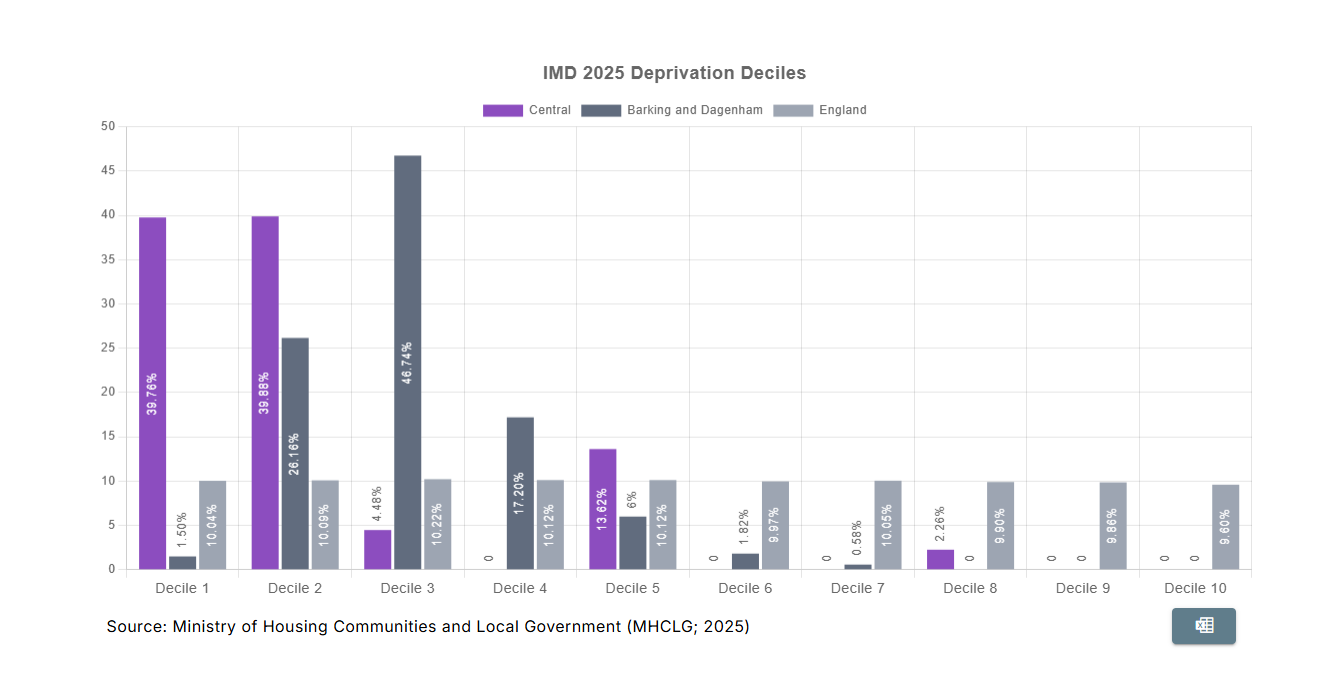
Many funding programmes use the Index of Multiple Deprivation (IMD) to identify…
More
The results of the May 2026 local elections provided plenty to reflect…
More
Local data and evidence on community needs, demographics and outcomes to support…
More