
The data that underpins Local Insight is used by more than 100 organisations to inform decision making and better target services.
We are committed to supporting organisations working for social good to better understand their areas – and believe you shouldn’t have to be a statistician to gain useful insights into the areas you work.
As well as building tools that put data back into the hands of end users, we also work with clients to help them understand the data, what the data can and can’t be used for and to drill down into specific issues and needs.
One example of this is recent work with St Luke’s Parochial Trust. The trust is located in the St Luke’s area of the Borough of Islington. After seeing some of the data included within the Local Insight tool, the Trust wanted to incorporate some local area statistics into their strategy evaluation.
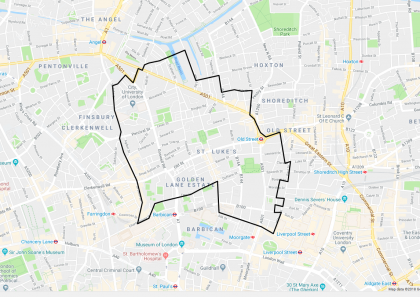
St Luke’s Parochial Trust’s Area of Benefit
OCSI were asked to present on a handful of key themes for their service area, in order to demonstrate that their focus areas are evidence based and matching need. The session also gave trustees an opportunity to ask questions and to identify any unmet needs in their area.
The presentation focused on three areas, taken from St Luke’s strategy document. The need to:
Using open data sources, the team at OCSI identified key data sources related to these themes for St Luke’s area of benefit (AOB). Throughout the presentation, these were compared to figures for Islington as a whole and the national benchmark. In cases where small area data wasn’t available, data for Islington was used as a proxy.
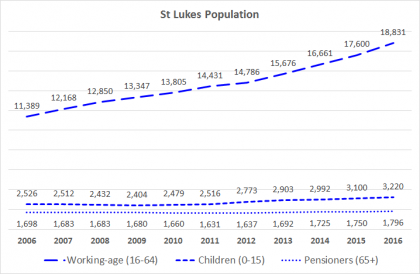
Between 2006 – 2016 the working-age population, as a share of total population has been growing in the St Luke’s AOB, with the share being approximately 6% higher in 2016 than 2006.
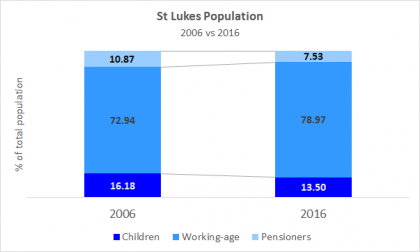
Source: Office for National Statistics
In 2006, St Luke’s AOB had a similar working-age share of the total population as Islington as a whole. By 2016, St Luke’s AOB was 3.4% higher.
The trend for England as a whole is starkly different. The working-age share of the total population is much lower for England as a whole. And in contrast to St Luke’s and Islington has decreased between 2006 & 2016.
Source: Office for National Statistics
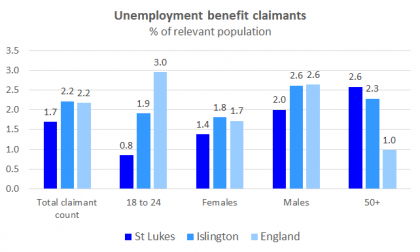
Source: Department of Work and Pensions, May 2018
As of May 2018, 1.7% of working-age people were receiving unemployment benefit, which is lower than average for Islington and England, both at 2.2%.
However, when looking at demographic breakdowns for claimant counts, the figures for over 50’s buck this trend. 2.6% of this demographic were receiving unemployment benefit. This is slightly higher than Islington as a whole (2.3%) and substantially higher than the national average (1.0%)
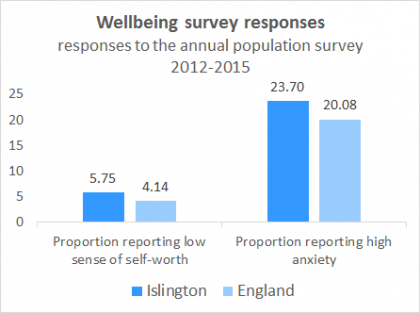
Source: Annual Population Survey: 2012 – 2015
St Luke’s AOB generally performs better than average on measures of physical health but worse than average on measures of mental health.
For example, St Luke’s AOB performs better than the national average on measures of adult obesity, estimate inactivity and claiming out-of-work benefits for health reasons.
Some measures of mental health are similar to the national average, for example claimant count for those receiving out-of-work benefits for mental health, as well as the suicide mortality rate (NB: this data is available only at Local Authority level and therefore cannot be apportioned to St Luke’s AOB).
However, measures from the Annual Population Survey on wellbeing indicate poorer mental health in Islington than compared to the national average. For instance, 23.7% of respondents from Islington reported high anxiety, compared to 20.08% nationally.
“Your presentation was excellent and gave the trustees and staff a lot of food for thought. Some of the information was fascinating! On a personal level, I am grateful to you for the preparation, for picking up on all the changes we requested and for always sticking to deadlines.” – Michael Ryan, Chief Executive, St Luke’s Parochial Trust.
Stepping back and taking a look at the big picture every once in a while can generate new ideas, solidify local knowledge and create a shared understanding across your team. Whilst the staff and trustees of St Luke’s were aware of the significant demographic changes in their area over the past ten years (for example, the increasing proportion of working age population), the presentations helped illustrate the extent of the change and the numbers of people in their target demographics.
The underlying data will never tell you the whole story – of course, you still need the rich, qualitative information to go alongside it. And with facts & figures at your disposal too, you will be able to create engaging stories, backed up with evidence.
Local area presentations from OCSI can
Find out more about our research services.

The English Community Needs Index (CNI) 2023 is now published as open…
More
Social housing providers have deep, experience-based knowledge of the communities they serve….
More
Many funding programmes use the Index of Multiple Deprivation (IMD) to identify…
More


