
Digital Exclusion is not a new topic. We know that even today, when people in the UK check their smartphones, on average, every 12 minutes of the waking day, there is still a proportion of the population that lack access to the internet and the skills to be able to use it (as well as those people who actively choose to disengage with the internet).
We also know that many of those that are digitally excluded are already likely to experience other challenges, such as the elderly, unemployed, people with disabilities and those in social housing. However, there is a lack of data available at a local level on those groups that are digitally excluded and where they are.
Beyond the issue of digital exclusion, greater insight into how different people are using the internet can only be a good thing and another tool that communications team can use to ensure that their messages are being delivered in the right way to the right people. This information could be used across the public and third sector to identify the most appropriate channels to communicate through, measure uptake of digital services and target digital literacy programmes.
The ESRC Consumer Data Research Centre (CDRC) at UCL has developed a Classification of Internet Use – how people living in different parts of the country interact with the internet. Although this internet engagement data alone doesn’t fill the data gap and can’t answer all questions relating to digital skills, it is great to see datasets that tackle this issue at a small area level. It is equally great that the data is updated regularly, providing an up-to-date picture of internet use, as well as insights into how areas are changing over time.
The classification uses data from the British Population Survey (BPS), which provides information on the behavioural characteristics of the population regarding various aspects of internet use. These are linked with demographic data from the Census and supplemented with data from online retailers and infrastructure data from Ofcom on download speed.
Every LSOA in England has been classified into 10 groups, detailed below.
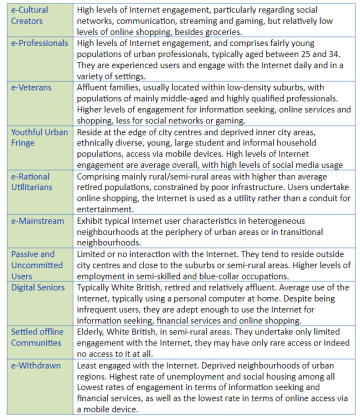
Source: Alexiou, A. and Singleton, A. (2018). ESRC Consumer Data Research Centre; Contains National Statistics data Crown copyright and database right (2017); Ofcom data (2016). CDRC data from Data Partners (2017)
CDRC have also produced a pen portrait for each of these groups, providing a profile of how each group interacts with the internet in regards to e.g typical hardware owned, how often they use the internet and the extent to which they use the internet for communication and entertainment.
Of course, some caution should be taken when using this data in isolation to target services, as whole LSOAs are being assigned single classification types and there will likely be notable differences in internet behaviours within an LSOA.
You can download the raw data at LSOA level and Pen Portraits directly from the CDRC website once you have registered for an account. You can also explore the data in interactive maps from CDRC too without registering for an account.
We have also added each of these classifications into Local Insight. As we have mentioned previously, these datasets give a really important insight into how people engage with the internet – but they are not the whole story.
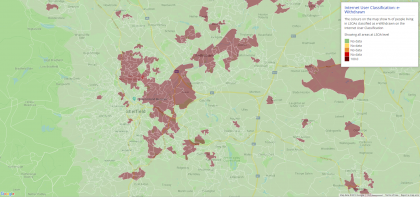
Map taken from Local Insight
Local Insight provides instant access to more than 1000 local level datasets, to help you gain a fuller picture of local communities, whether that is to target communications more effectively or to ensure that resources are being targeted towards those most in need. Local Insight also aggregates all of this data to the areas you care about, whether that is wards, parishes, parliamentary constituencies or a town centre. Take a look for yourself by requesting a demo or get in touch with the team on info@ocsi.co.uk.

The English Community Needs Index (CNI) 2023 is now published as open…
More
Social housing providers have deep, experience-based knowledge of the communities they serve….
More
Many funding programmes use the Index of Multiple Deprivation (IMD) to identify…
More


