This is a guest post by James Bowles, PhD student at the Third Sector Research Centre, University of Birmingham.
Amidst the wider ‘data revolution’, the UK’s third sector is undergoing a significant shift in the way that data is gathered, used and shared. As many third sector organisations are inherently spatial in nature (through limited resources, defined area of operation or by focussing on a spatially orientated issue), it is no surprise that a place-based perspective and spatial data use is increasingly important in the day to day operations of many third sector organisations.
Over the past 6 months, I’ve been exploring how organisations of varying income levels and thematic areas of operation use data that has a spatial component to it (e.g. postcode, administrative/statistical boundary, or coordinates) and the tools they use to support them, such as Local Insight.
I’ve found 30 exciting cases of spatial data use so far, and through interviews with staff members and volunteers, we can see how spatial data has helped organisations get to grips with place-based approaches, to know their service users better, and to demonstrate potential and actual/realised impact.
Not all examples mentioned made use of Local Insight, however, the underlying data and approaches are replicable in the Local Insight tool.
Taking a holistic policy and practice approach to an issue, within a defined geographic area, is in vogue amongst third sector organisations. So much so that a pledge to prioritise place-based working has been signed by organisations from across the third sector.
When working within place it’s important to understand geographic variations within the defined area. For a medium-sized healthcare charity working across two local authorities, visualising data on childhood obesity by Middle-Layer Super Output Area (MSOA) gave an immediate sense of where to prioritise their resources and begin in-depth qualitative research.
“We were really struggling to know where to start and what the scale was, but the real breakthrough was when we started mapping obesity prevalence…what emerged was this like – oh my word, they’re all next to each other – which answered our question about where to start! We’ll start there…we’ve got our obesity ‘corridor’ ”. Head of Data and Analytics, Healthcare Charity.
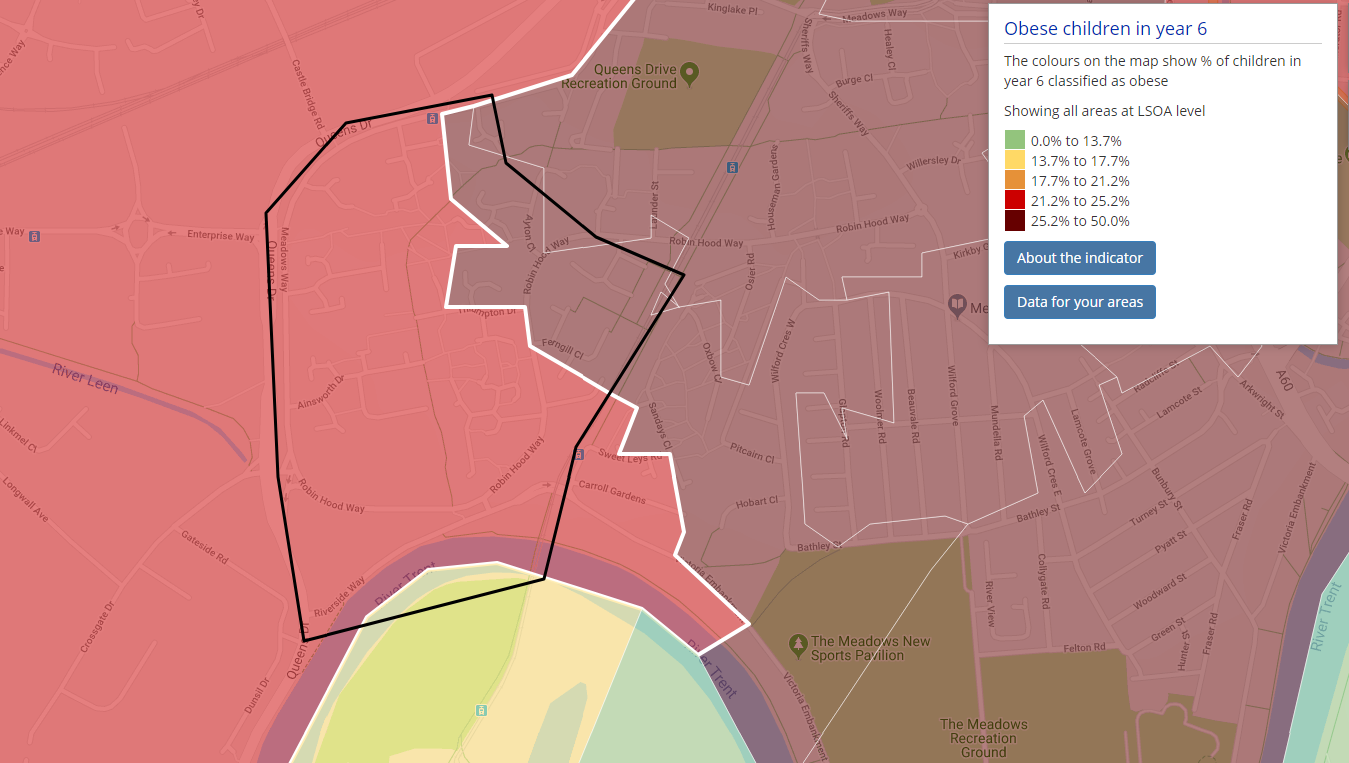
[Click to enlarge] Replicate this in Local Insight: Local Insight includes indicators on childhood obesity. These can be viewed on a map at LSOA, MSOA or Local Authority level. You can also create any area that you like (whether that is a selection of LSOAs, a ward, or a bespoke catchment area) and immediately see the data value for this area.
In 2007 a small church in a populous city suburb started collecting data on their 60 regular members in an effort to understand who was attending and where people travel from. Knowing where members live has allowed the church to change the location of its events to suit members and adjust their advertising strategies, but it has also been able to compare the demographics of its membership base with that of the local area. While census data is drawn from 2011, it still provides a useful baseline with which to compare membership and local area data and consequently adjust strategies to attract a wider population that is in line with the local demographic.

[Click to enlarge] Replicate this in Local Insight: You can create custom geographies based on postcodes in Local Insight. From here, you can generate in-depth profile reports based upon where your service users are coming from; covering everything from population to health to education.
Tools such as Local Insight can assist with visually understanding and demonstrating current and potential impact, a challenge that many third sector organisations face.
One example is a large national charity that helps people in times of immediate crisis. Data on people who have been assisted by volunteer teams is collected and postcode data mapped, with the aim of knowing more about service users’ backgrounds and informing future campaign work. By analysing patterns in current service user data (age, gender, ethnicity, location, etc.), educational outreach teams can target a particular geographic area or similar demographic groups to those being assisted in order to prevent future cases from arising and create a positive feedback loop.
Infrastructure bodies that support and represent other local third sector organisations occupy a unique position of knowing the local sector beyond solely those on regulatory datasets and listings. Combining this knowledge on local third sector activity with the contextual data on local need allows infrastructure bodies to demonstrate potential impact and encourage organisations to shift or expand their geographic or thematic area of operation.
“We might not have any disability organisations in that area of the city despite the fact that the demographic data shows a higher than average percentage of disabled people living in those areas, so we’d work with organisations that do provide those services to look at how they could move into those areas and how those groups can work with other organisations” Policy Manager, Infrastructure Body
In both cases, viewing unique data held by the organisation alongside contextual open data provides a powerful way of demonstrating current and potential impact.
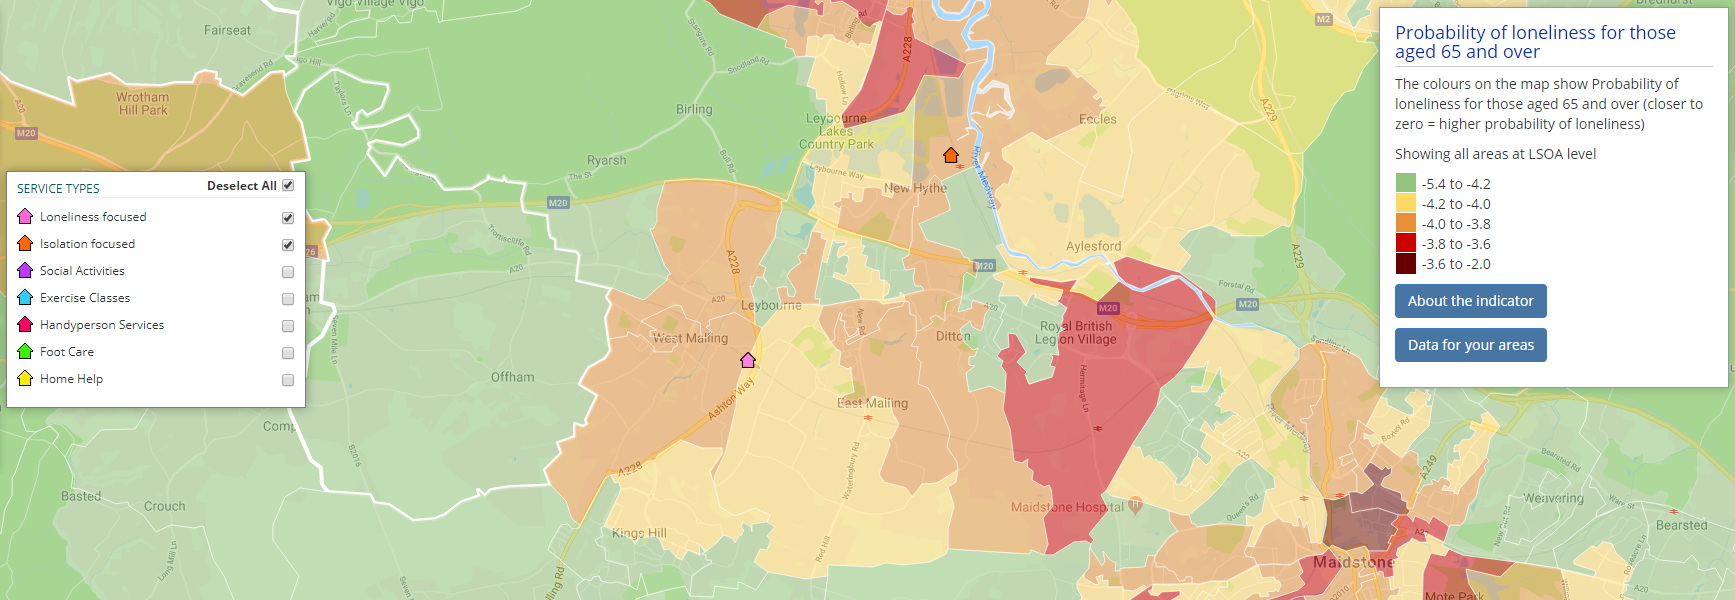
[Click to enlarge] Replicate this in Local Insight: Upload a list of all local charities and community groups operating in your area, which are displayed as icons on the map. You can categorise these based on a theme; for example, disability focused, health-focused, loneliness focused. You can then overlay this data with contextual data to compare whether local service provision is meeting local need.
Interviewees from across the sector have speculated that spatial data use by third sector organisations is “going to be the next big thing” or is “about to explode”, and there’s strong reason to believe that this is true. Externally, the Cabinet Office led Geospatial Commission is growing the geospatial ecosystem. Internally, organisations are investing in human and technological capacity to spatially visualise and understand their data, with the announcement of 360Giving’s plans for a ‘Giving Map’ of UK grant distribution being one such example. Local Insight provides an intuitive and tailored point of access to spatial data sets that assist with working in place, understanding service users and volunteers, and demonstrating current and potential impact.
I would love to hear from you if your third sector organisation uses spatial data or GIS. You can contact me on j.bowles.1@pgr.bham.ac.uk for more information.
To take a look at Local Insight for yourself, sign up for a demo or get in touch with the team on info@ocsi.co.uk

The English Community Needs Index (CNI) 2023 is now published as open…
More
Social housing providers have deep, experience-based knowledge of the communities they serve….
More
Many funding programmes use the Index of Multiple Deprivation (IMD) to identify…
More


