
This series looks at a few key themes that are likely to be having an impact on local places and local people in the wake of the pandemic. In each post we look at some small area datasets that could be used to help understand communities and inform decisions on local policy. Here we focus on neighbourhood data on mental health.
The effects of the pandemic and lockdown on mental health paint a stark picture.
Restrictions to curb the spread of coronavirus in the UK have driven stress, anxiety and depression far above normal levels and may do again in coming months if widespread lockdowns are re-imposed, researchers say.
Office for National Statistics figures suggest that twice as many adults in Britain are reporting symptoms of depression now compared with this time last year and those aged under 25 are three times more likely to report that they are not enjoying their day-to-day activities as much as they were two years ago, while almost half said they were struggling to concentrate, compared with just over a fifth in 2018.
This selection of indicators looks at some of the small-area data available related to mental health conditions. These may be useful in identifying areas with higher proportions of vulnerable residents.
All of this neighbourhood data on mental health is available in Local Insight for any area you care about – whether that is wards, parishes or towns. Register for a demo to find out more.
Source: Place-Based Longitudinal Data Resource (PLDR)
Timepoint: 2019
How often updated: Irregular
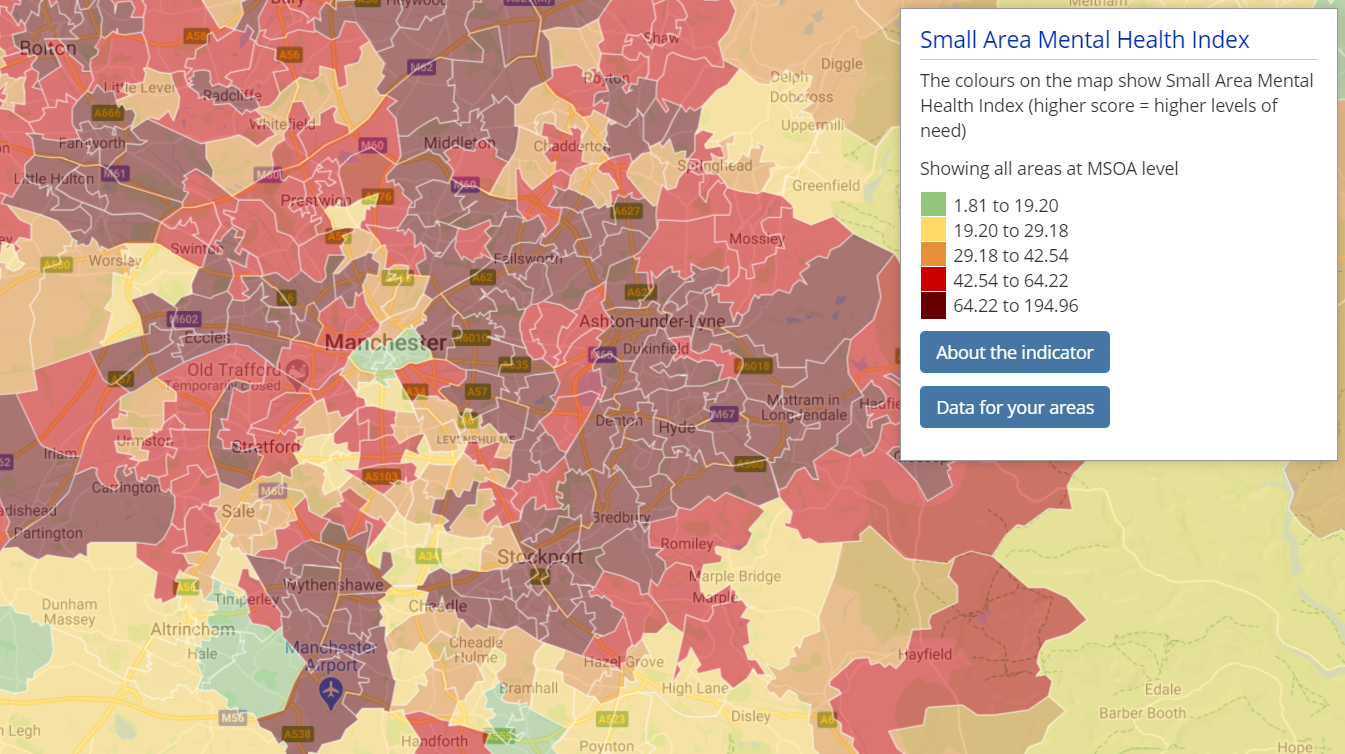
The SAMHI is a composite annual measure of population mental health for each Lower Super Output Area (LSOA) in England.
The SAMHI combines data on mental health from multiple sources into a single index including:
A higher score indicates that an area is experiencing high levels of mental health need.
The SAMHI is an attempt to update the Indices of Deprivation Mood and Anxiety Disorders indicator (more on this below). It includes a broader set of data but some data included in the Mood and Anxiety Disorders indicator won’t be available in this index.
Source: House of Commons Library
Timepoint: 2019/2020
How often updated: Irregular

Prevalence of mental health conditions. Dashboard from Local Insight
These estimates are based on analysis of 2019/20 data from England’s GP practices published by NHS Digital. NHS Digital also publishes figures on GP practice ‘footprints’ – i.e. the LSOAs in which the patients of each GP practice live. By combining this data with practice-level data on prevalence, it’s possible to estimate variation of health conditions in between neighbourhoods.
The data provides estimates on the prevalence of a number of health conditions including:
There are some caveats to be aware of when using this data:
Source: Age UK
Timepoint: 2011
Next updated: Irregular
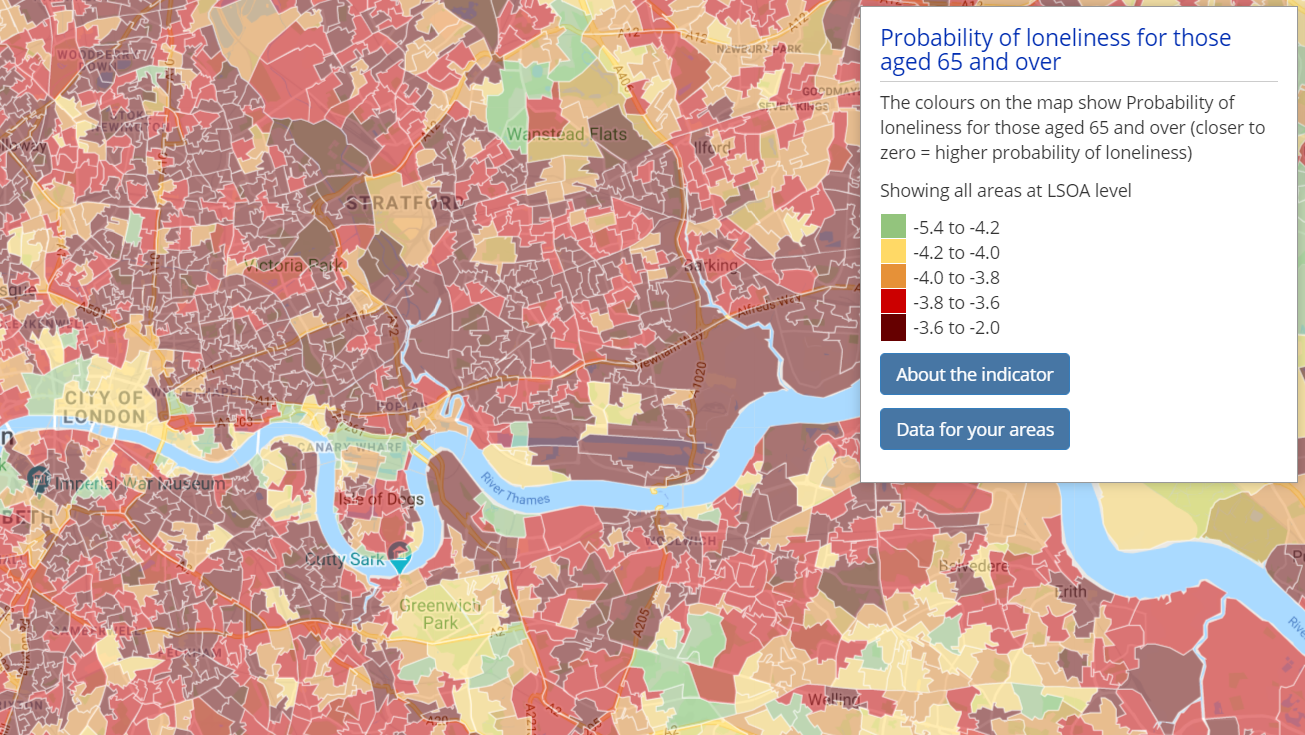
Prevalence of loneliness. Map from Local Insight
Although feeling lonely isn’t in itself a mental health problem, the two are strongly linked with some research suggesting that loneliness is associated with an increased risk of certain mental health problems, including depression, anxiety, low self-esteem, sleep problems and increased stress.
This indicator provides a prediction of the prevalence of loneliness amongst usual residents, living in households, aged 65 and over.
The prevalence of loneliness indicator uses data from the English Longitudinal Study of Ageing (ELSA) survey, to identify predictors of loneliness in older age. The results from this modelling were applied to data from Census 2011 to predict the prevalence of loneliness across small area geographies such as Output Areas (OAs), Super Output Areas (LSOAs and MSOAs) and local authorities. This starts with a base value, which is then adjusted based on a number of other variables. The result is a final prediction value for each person, and results are displayed as averages for each geographical area. Areas with a value closer to 0 predict a greater prevalence of loneliness amongst those aged 65 and over and living in households compared to areas with a value further away from 0.
As this is a modelled indicator using a larger survey and the census data on household living arrangements to get estimated values at small area level caution should be taken as it does not take into account wider factors that may affect loneliness locally.
Source: Ministry of Housing, Communities and Local Government
Timepoint: 2013 – 2018
Next updated: Irregular
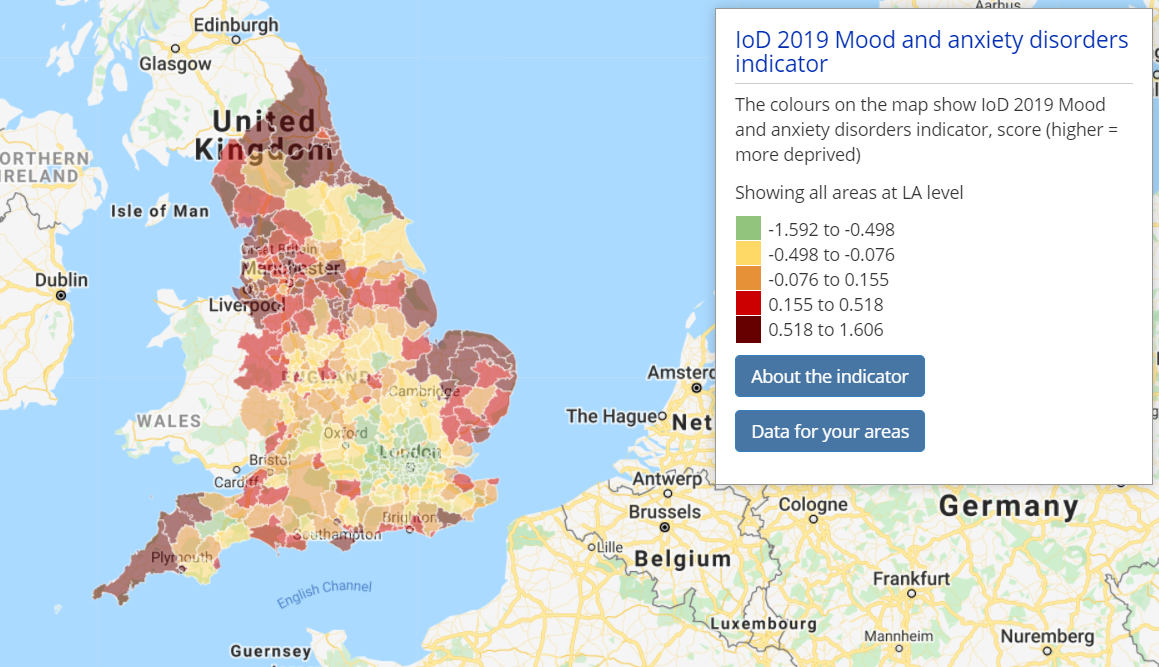
Indices of Deprivation 2019 Mood and Anxiety Disorders. Map from Local Insight
This indicator provides a broad measure of levels of mental ill health in the local population. The definition used for this indicator includes mood (affective), neurotic, stress-related and somatoform disorders. The indicator is a modelled estimate based on three separate sources:
Although none of the three sources on their own provide a comprehensive measure of mood and anxiety disorders, used in combination they represent a large proportion of all those suffering mental ill health. A higher score represents a more deprived area in regards to mood and anxiety disorders.
In the Indices of Deprivation 2015 (and earlier) this indicator also included a fourth component which was derived from health benefits data from the Department for Work and Pensions. The health benefits data component has been dropped from this indicator for the Indices of Deprivation 2019 due to concerns about the quality of the data on health conditions within the health benefits dataset.
All of this neighbourhood data on mental health and more are available to use in our Local Insight platform:
This blog post also appears on the Local Insight website.

The English Community Needs Index (CNI) 2023 is now published as open…
More
Social housing providers have deep, experience-based knowledge of the communities they serve….
More
Many funding programmes use the Index of Multiple Deprivation (IMD) to identify…
More


