
This series looks at a few key themes that are likely to be having an impact on local places and local people in the wake of the pandemic. In each post, we look at some small area datasets that could be used to help understand communities and inform decisions on local policy. Here we focus on neighbourhood data on communities.
The power of communities and mass citizen engagement has become all the more apparent in 2020. From the rapid mobilisation of Mutual Aid groups to the ‘army of volunteers’ signed up to support vulnerable people.
Research from New Local Government Network is starting to show that Local Authorities that have already built strong relationships with their communities are one step ahead when it comes to dealing with the current crisis.
Local Authorities have also had to quickly build and strengthen relationships with local Voluntary and Community Sectors into solid delivery partnerships to meet the needs of the most vulnerable residents.
This selection of neighbourhood data on communities looks at some of the factors that could contribute to a strong community, to help highlight local assets and identify areas which may need more external support whether that is from local authorities, funders or charities.
All of the neighbourhood data on communities below are available in Local Insight for any area you care about – whether that is wards, parishes or towns. Register for a demo to find out more.
Source: Oxford Consultants for Social Inclusion (OCSI) and Local Trust
Timepoint: 2023
How often updated: Irregular
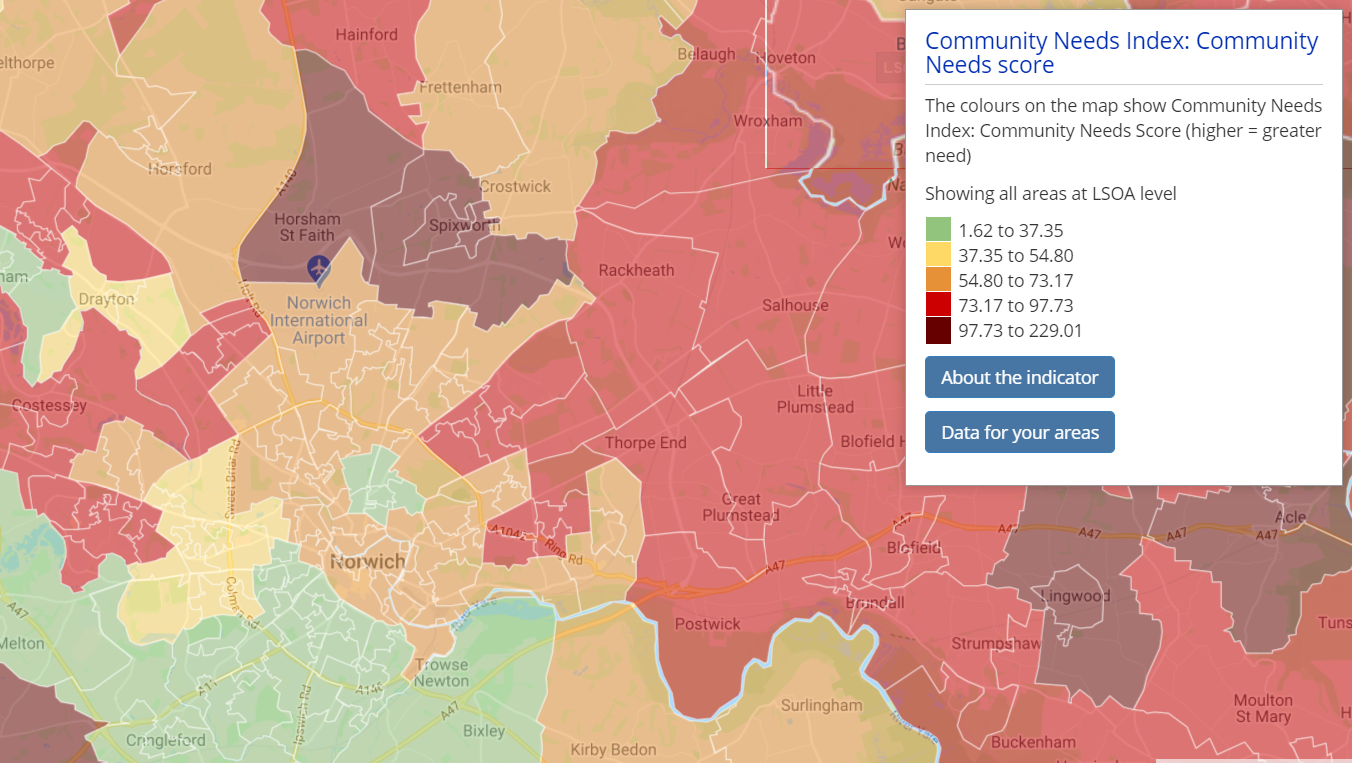 Community Needs Index. Map from Local Insight.
The Community Needs Index (CNI) , the first composite indicator of its kind, looks at the social and cultural factors that can contribute to poorer life outcomes. The CNI was used to develop a quantitative measure of ‘left-behind’ areas (read the full publication).
The overall CNI covers 19 indicators, across three domains;
Further reading: Community Needs Index 2023
Source: Electoral Commission
Timepoint: 2016 – 2019
How often updated: Annually
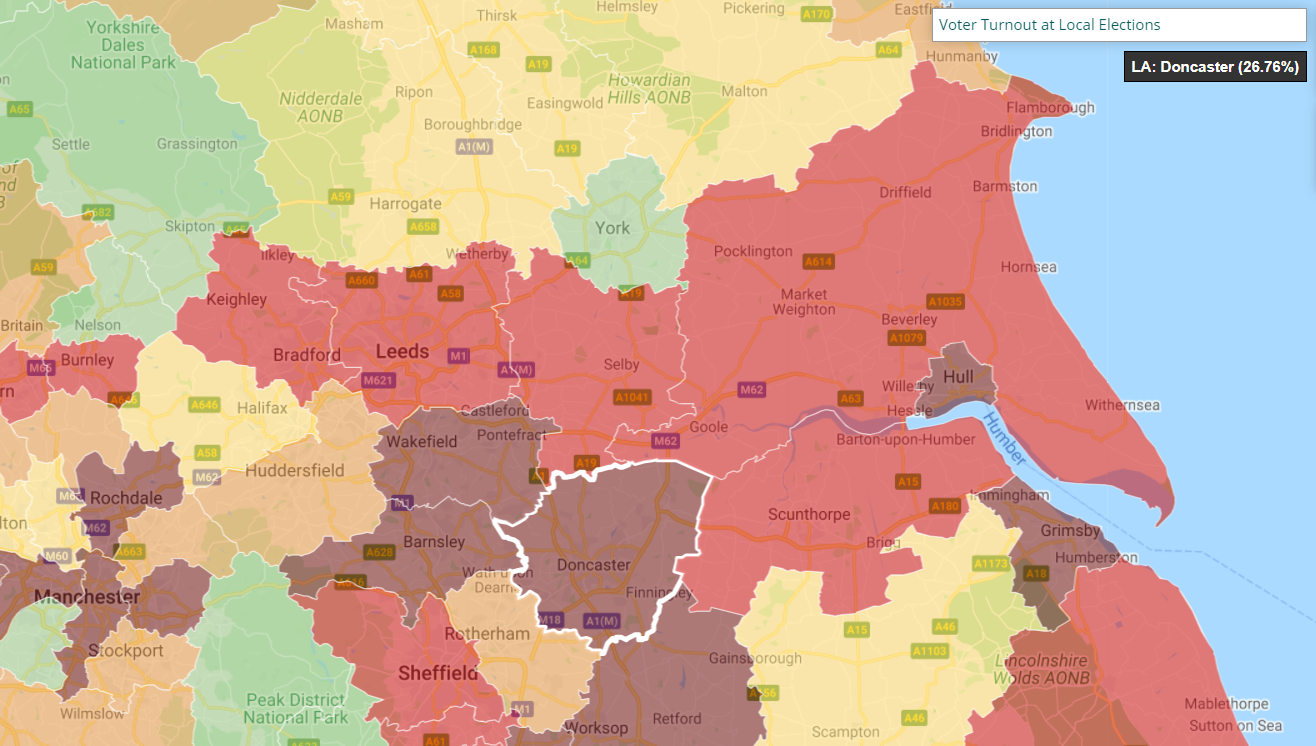 Voter turnout at local elections. Map from Local Insight
The data shows the valid voter turnout (%) at the most recent Local Council Election (held between 2016 and 2019). Voting in local elections can be used as an indicator of civic participation and how likely people are to be engaged with local issues.
However, there is some local variation in the frequency and date of Local Elections, with different parts of the country going to the polls at different times and with different levels of regularity.
Caution is therefore advised when drawing direct comparisons between local areas, as the socio-political context varies from year to year with associated impacts on turnout rates. We have taken steps to adjust turnout figures from previous years either upwards or downwards to the 2019 average to reflect variation in turnout across different years.
Another factor affecting turnout is whether the local election is concurrent with other elections (for example turnout is generally higher when General Elections coincide with Local Elections). Frequency can also have an impact on turnout with a risk of electoral fatigue in areas required to re-elect councillors on an annual basis.
Source: Charity Commission
Timepoint: 2021
How often updated: Irregular
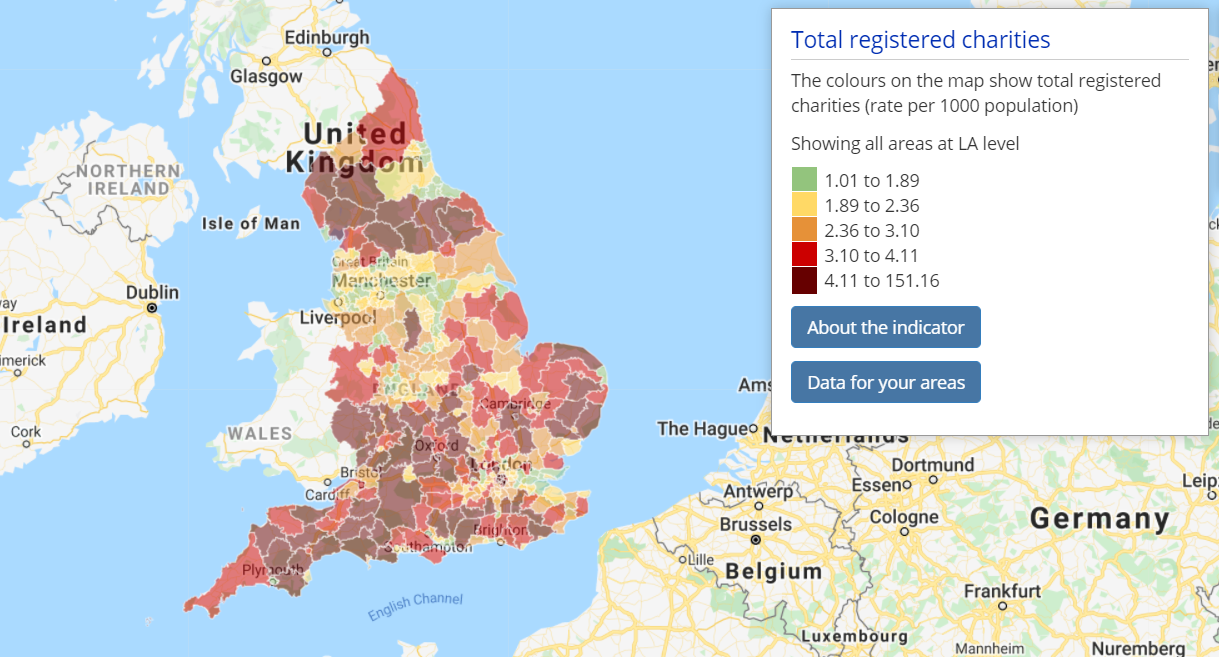 Total registered charities. Map from Local Insight
This data shows the total number of registered charities per head of the population. The data adds to a small data landscape for measures of third sector activity and service provision. It provides insight into the level of activity and engagement in the community from third sector organisations.
This can be used by grantmakers and charities to inform decisions on where to work, highlight areas that may need more support from the third sector, and form part of an assessment as to whether service provision is meeting local need through comparison alongside the Indices of Deprivation, for example.
The data is, however, based on the location of charities rather than where they operate. A charity based in an area may not necessarily reflect direct activity by that charity in that area, some of which may have a wider focus, even global.
Source: Department for Transport (DfT)
Timepoint: 2021
How often updated: Annually
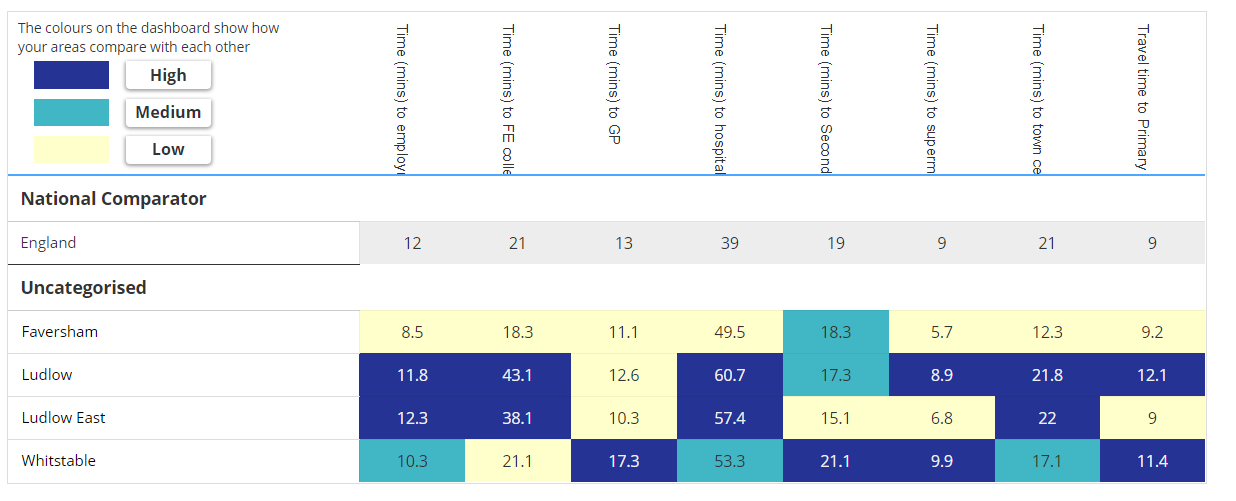 Travel time to services. Dashboard from Local Insight
This set of datasets show travel times in minutes to a number of key amenities by public transport, walking and cycling. These statistics are derived from the analysis of spatial data on public transport timetables; road, cycle and footpath networks; population and key local services. The data shows the average minimum travel time – the shortest travel time by walking and public transport, averaged over the LSOA.
The data could be used to highlight areas where services are not present in local communities or where improvements in transport provision may be needed to widen people’s access and address social isolation.
The amenities covered include:
All of this neighbourhood data on communities and more are available to use in our Local Insight platform:
This blog post also appears on the Local Insight website.

The English Community Needs Index (CNI) 2023 is now published as open…
More
Social housing providers have deep, experience-based knowledge of the communities they serve….
More
Many funding programmes use the Index of Multiple Deprivation (IMD) to identify…
More


