
This series looks at a few key themes that are likely to be having an impact on local places and local people in the wake of the pandemic. In each post we look at some small area datasets that could be used to help understand communities and inform decisions on local policy.
The pandemic has led to many households experiencing financial hardship either for the first time or more acutely than in the past. IPPR’s research finds it highly plausible that over 1 million more people will be under the pre-Covid poverty line compared to a situation where the pandemic had not occurred, including 200,000 children, at the end of the year.
We have seen sharp increases in unemployment across the country with every local authority seeing unemployment rise by one-third and 20% of local authorities seeing the unemployment rate double as of 9th April 2020, compared with unemployment levels on 12th March 2020 (the last reference period before England went into lockdown).
Food bank usage has soared, with data from Trussell Trust indicating that across April there was an 89% increase in need, compared to the same period last year.
As the Coronavirus Job Retention Scheme is due to finish at the end of October, there are fears of an even larger unemployment crisis if additional targeted support is not given to some industries and workers most at-risk of redundancies.
This selection of indicators looks at some of the small-area data available related to financial hardship that may be useful in identifying areas with higher proportions of residents at-risk of unemployment and financial hardship.
All of the datasets below are available in Local Insight for any area you care about – whether that is wards, parishes or towns. Register for a demo to find out more.
Source: Department for Work and Pensions (DWP)
How often updated: Monthly
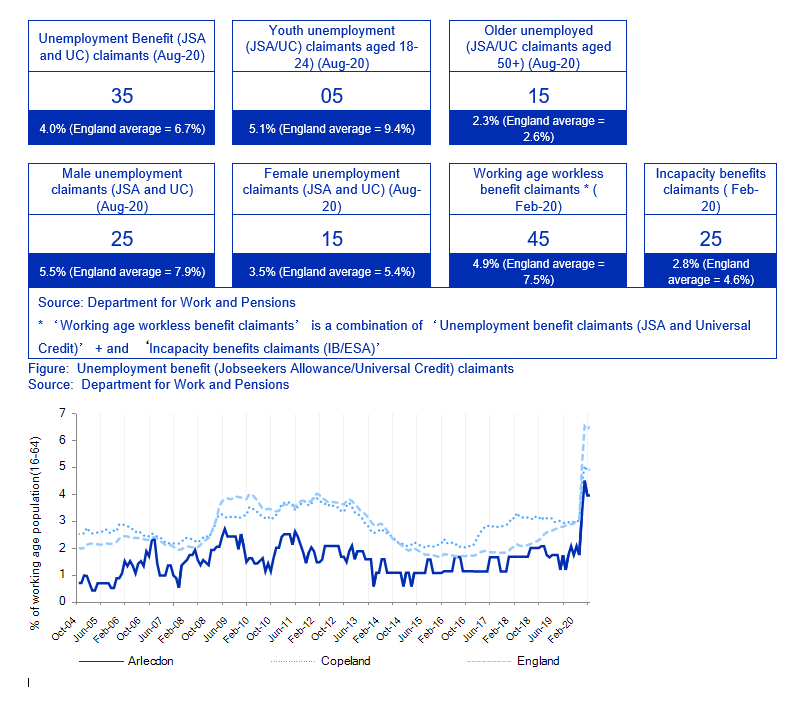
Unemployment figures for Arlecdon Ward in Copeland. Report from Local Insight.
This indicator shows the proportion of people receiving benefits payable to people who are unemployed receiving either Jobseeker’s Allowance (JSA) or Universal Credit for those who are out of work.
This has replaced the number of people claiming Jobseeker’s Allowance as the headline indicator of the number of people claiming benefits principally for the reason of being unemployed and is sometimes referred to as the monthly claimant count.
As data is published on a monthly basis, it is a useful dataset in order to be able to see changes over time, particularly when events such as the pandemic cause sudden spikes. We have included time series data for Unemployment in Local Insight since March 2020.
Please note, there are differences in conditionality rules and eligibility criteria between Universal Credit and Jobseeker’s Allowance. The phased roll-out of Universal Credit across the country, means that these differences in eligibility and conditionality affect geographical places differently depending on how advanced the roll out is in that area.
Until Universal Credit is fully rolled out, it is not possible to get a consistent measure of unemployment benefit claimant rate. Furthermore, the Universal Credit ‘searching for work’ conditionality group includes some individuals who would not have been previously eligible for Jobseeker’s Allowance under the old benefits system e.g. those with work limiting illness awaiting a Work Capability Assessment.
Therefore, there is likely to be a slight overcount of people identified as unemployed in areas where the roll-out is more advanced. This is likely to have been exacerbated during the pandemic as there has been an easing of the usual work-search conditions and contact between claimants and work coaches during the lockdown.
As a result of these changes UC recipients have not had their work status accurately updated as quickly as they otherwise would. This is particularly important in light of the Coronavirus Job Retention Scheme (CJRS), with some furloughed workers making an out-of-work UC claim that would have placed them in the Claimant Count, before they knew they were furloughed. In other words some furloughed workers are likely to be now included in the claimant count statistics even though they are still technically in employment. See Resolution Foundation’s brief for more details.
Read our guide on understanding umemployment data for more information
Source: Oxford Consultants for Social Inclusions (OCSI)/ Office for National Statistics(ONS)/ Business Register and Employment Survey (BRES) (using methodology developed by RSA)/ Census 2011
Time point: 2020 (employees data from 2011, jobs data from 2018, Furlough data from 2020)
How often updated: Irregular
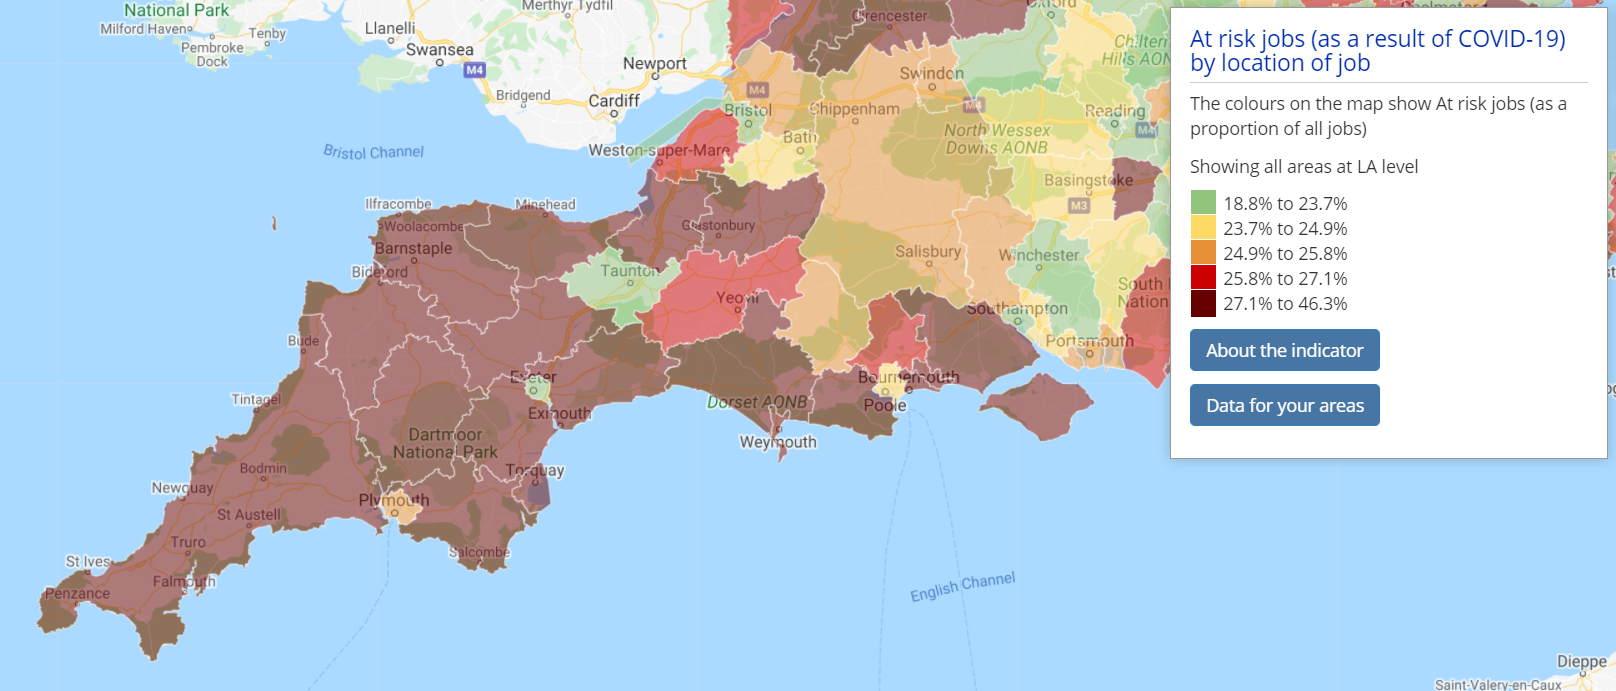
Shows jobs at-risk at Local Authority level. Map from Local Insight
We constructed two small area datasets looking at at-risk jobs by location of job and at-risk employees by employee residence.
These are based on analysis from RSA, which we extended to look at jobs at risk at a more granular level in order to estimate the extent of risk across local labour markets within Local Authorities as well as identifying the neighbourhoods with the highest concentrations of people who have been furloughed.
The data may be of particular interest to those working on economic and regeneration strategies as part of an evidence base to highlight where investment may be needed to diversify the economy, encourage start-ups and support vulnerable businesses.
The at-risk jobs indicator is calculated based on furloughing data from the ONS and the jobs profile for each local area, whereas the at-risk employees indicator is calculated based on the latest furloughing data from the ONS and the employee profile for each local authority.
Employees in industry sectors that were not recorded in the ONS Business Impact of Coronavirus Survey (BICS) due to inadequate sample size have not been included in the numerator or denominator for this dataset – these include Agriculture, forestry and fishing, Mining and quarrying, Electricity, gas, steam and air conditioning supply, Financial and insurance activities, Real estate activities and Public administration and defence.
Source: Department for Work and Pensions
Timepoint: 2018/19
Next updated: Unknown
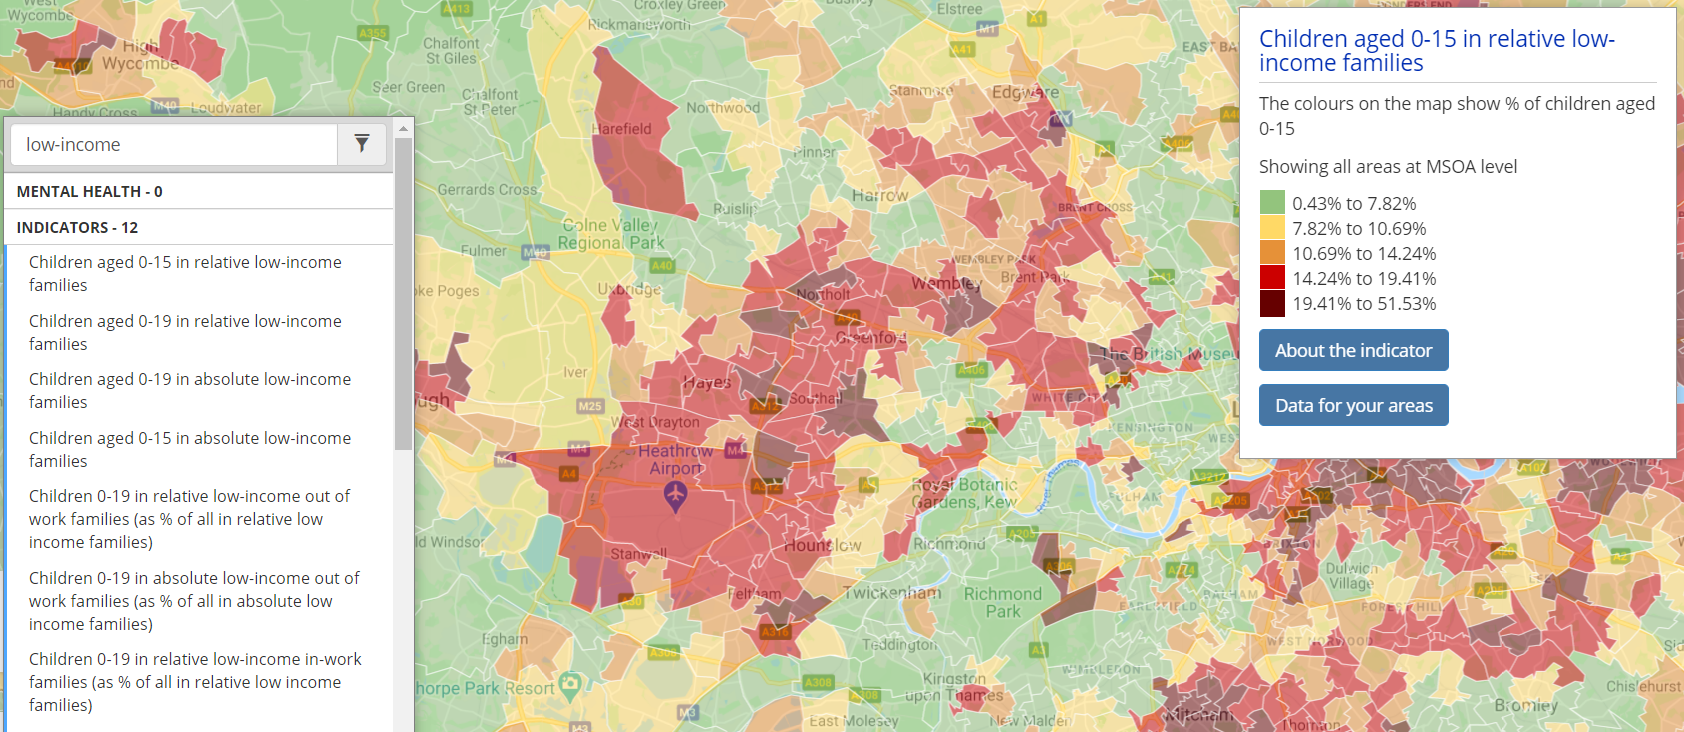
Children in low-income families. Map from Local Insight.
This set of 20 indicators provides breakdowns of children in low-income families based upon:
These are new statistics and should be viewed as a companion release to the Households Below Average Income (HBAI) survey on children in low income households which provides National and Regional estimates but not local area estimates. These local area statistics are calibrated to, and thus match, the 3-year average HBAI survey estimates at Region and Country level for Great Britain.
The children in absolute and relative low-income families indicators are shown as a proportion of all children, whereas all of the other breakdowns display as a proportion of all children in relative / absolute low-income families.
Source: British Red Cross
Timepoint: June 2020
Next updated: Unknown
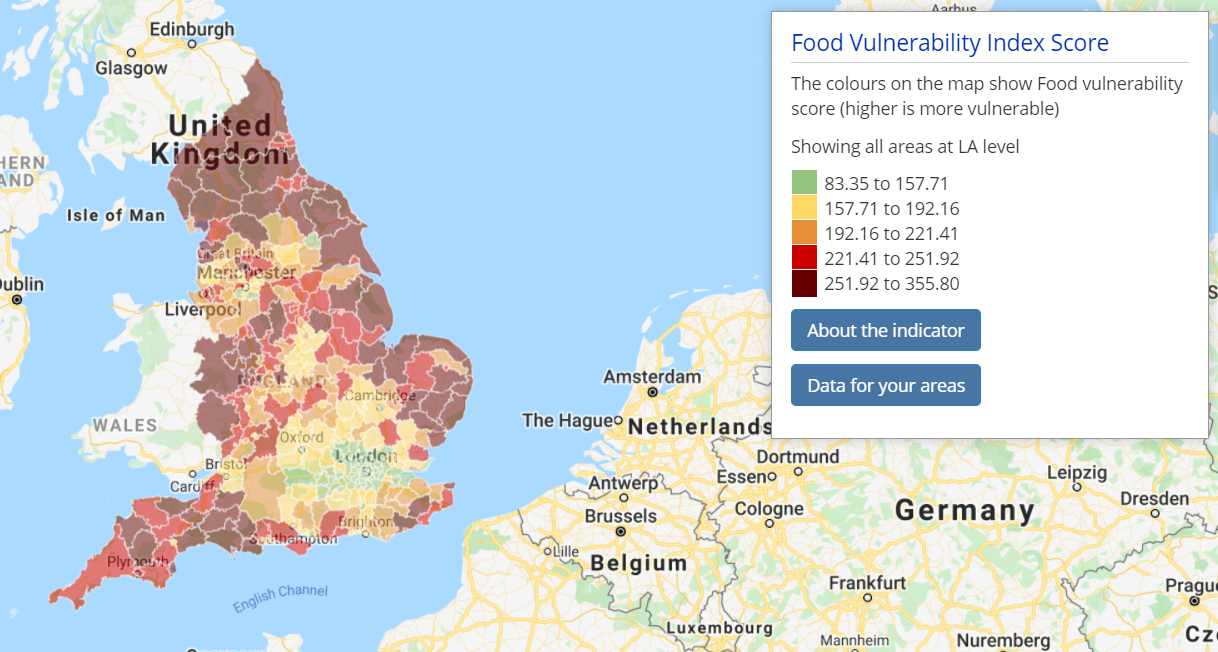
Food Vulnerability Index developed by British Red Cross. Map from Local Insight.
Shows the food vulnerability index score, where a higher number indicates more vulnerable. Studies of food insecurity in the UK (e.g. Smith et al. 2018) model this using a combination of benefits claims and household-level insecurity (e.g. living alone as an older person or person with low income, especially with dependent children).
For this bespoke Food Vulnerability Index, Red Cross have combined these indicators with others that are relevant to food insecurity during Covid-19. These include; Frailty, Living alone, Distance to services, Digital exclusion, Income deprivation, Income Support families, Income-based Jobseeker’s Allowance families, Income-based Employment and Support Allowance families, Pension Credit (Guarantee) families, Working Tax Credit and Child Tax Credit families not already counted, Universal Credit families where no adult is in ‘Working – no requirements’ conditionality regime, Asylum seekers in England in receipt of subsistence support, accommodation support, or both.
Read more on the Red Cross COVID-19 Food Vulnerability Index as well as the COVID-19 Vulnerability Index and the Hardship Fund Vulnerability Index.
Source: Ministry of Housing Communities and Local Government (MHCLG)
Timepoint: 2019
Next updated: Irregular
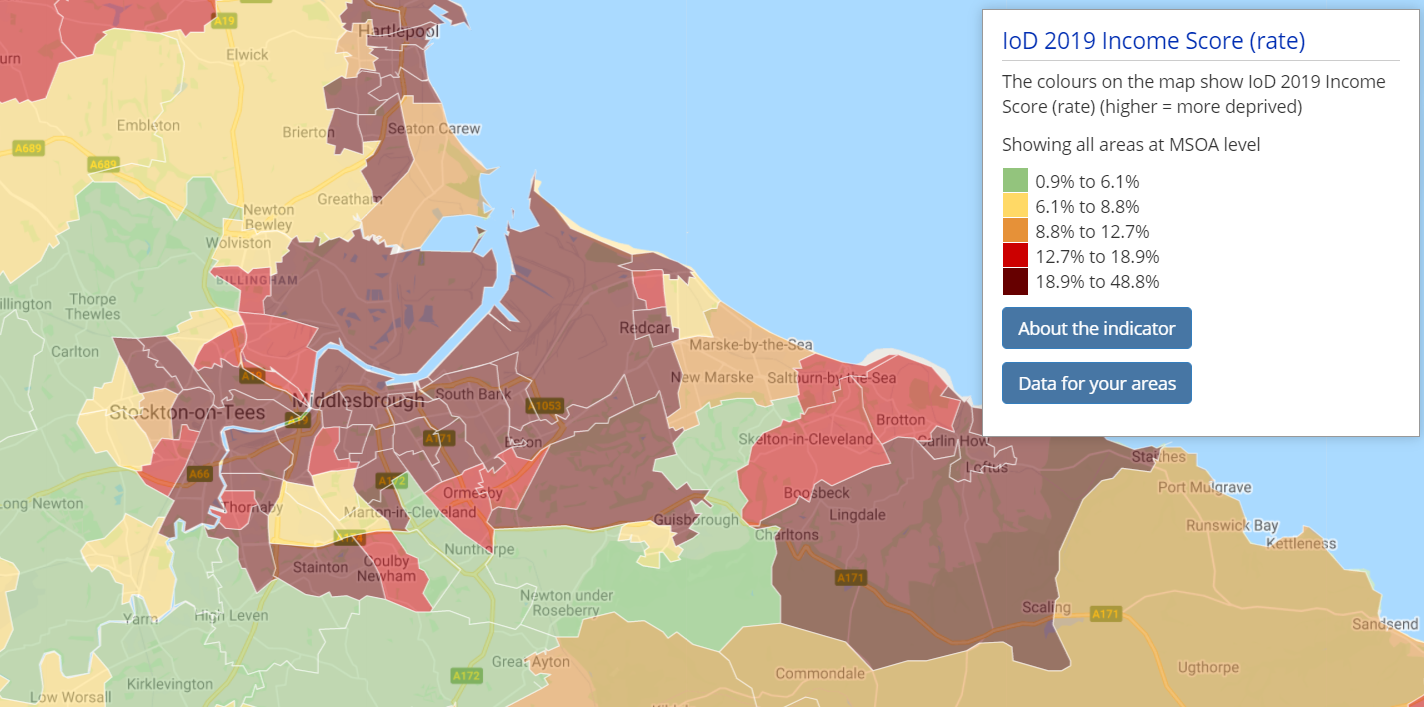
Indices of Deprivation 2019 Income Score. Map from Local Insight
The Indices of Deprivation (IoD) 2019 Income Deprivation Domain measures the proportion of the population in an area experiencing deprivation relating to low income. A higher score indicates that an area is experiencing high levels of deprivation.
The definition of low income used includes both those people that are out-of-work and those that are in work but who have low earnings (and who satisfy the respective means tests).
The following indicators are included: Adults and children in Income Support families; Adults and children in income-based Jobseeker’s Allowance families; Adults and children in income-based Employment and Support Allowance families Adults and children in Pension Credit (Guarantee) families; Adults and children in Working Tax Credit and Child Tax Credit families not already counted that is those who are not in receipt of Income Support income-based Jobseeker’s Allowance, income-based Employment and Support Allowance or Pension Credit (Guarantee) and whose equivalised income (excluding housing benefit) is below 60% of the median before housing costs; Adults and children in Universal Credit families where there are no adult is in ‘Working – no requirements’ conditionality regime and Asylum seekers in England in receipt of subsistence support accommodation support or both.
All of these datasets and more are available to use in our Local Insight platform:
This blog post also appears on the Local Insight website.

The English Community Needs Index (CNI) 2023 is now published as open…
More
Social housing providers have deep, experience-based knowledge of the communities they serve….
More
Many funding programmes use the Index of Multiple Deprivation (IMD) to identify…
More


