
In a previous blog we have spoken in broad terms about the role of small area data in forming a response to the Covid-19 pandemic – how the measures of our communities at local level drive an understanding of transmission of the virus and help how to predict patterns and which communities would be impacted. Not just directly, through the identification of where the virus is most prevalent and which groups it has the greatest impact on in terms of clinical outcomes, but also indirectly by identifying socio-economic risk factors and groups that have been disproportionately affected. Small area data is key, too, for understanding how modelling work is used to help predict future hotspots of both the socio-economic consequences and the clinical impact.
Local level data already in Local Insight can also be used to track wider social and economic consequences arising from the pandemic and subsequent lockdowns, such as the changes in the labour market and impacts on mental health. Data can be used too, to monitor where action is being taken to address some of the challenges arising from the pandemic, such as the vital role of the voluntary sector in supporting the worst affected communities.
Developments in Local Insight in response to COVID-19
In order to support the voluntary sector and other Local Insight users to achieve their aims when fighting the pandemic and its knock-on unintended consequences, we have created a single data download at MSOA level that provides easy access to key indicators in this fight.
One such indicator added to Local Insight is the Covid Vulnerability Index (CVI) developed by the British Red Cross. The Red Cross CVI brings together data on clinical vulnerability, demographic vulnerability, social vulnerability and health inequalities to identify neighbourhoods ‘at risk’ from the effects of COVID-19. We supported the British Red Cross in the development of the CVI, with 27 of the 47 indicators that make up the index sourced from Local Insight.
It is important to note a number of caveats that must be considered when using the CVI; the index measures risk, not direct impact; the index includes modelled data; and finally, the index is meaningful only in a ‘relative’ sense; ie you can compare areas against one another, but you cannot use the scores to compare the extent to which one area has greater vulnerability than another in an absolute sense. As well as adding the CVI to Local Insight, we have added a number of underlying subdomains and indicators where we are able to obtain these from the Red Cross:
As well as developing new indicators for Local Insight, we have done some work to make it easier to interpret some of the existing indicators in the tool.
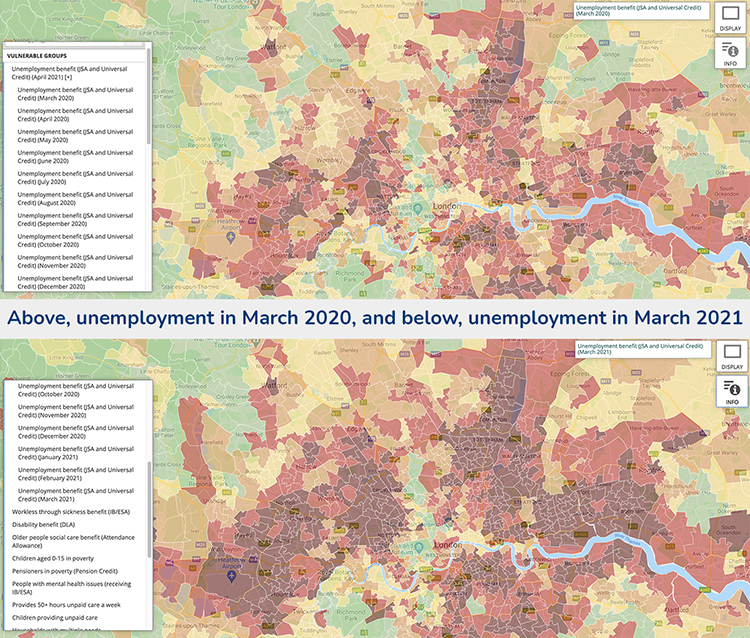
Unemployment
One of the most notable and visible impacts of the pandemic in local areas has been the large changes in unemployment since March 2020 – unemployment rates have more than doubled across the majority of neighbourhoods in England.
In order to track this rapidly changing picture, we have stopped overwriting unemployment data from previous timepoints and have been adding each monthly snapshot as a new indicator. As a result, you can now look at the month-on-month changes from March 2020 onwards to see how the pandemic has impacted on the labour market in your local area. This can be viewed in addition to the trend data in the reports which provides a more long-term picture.
Furlough
In addition to large increases in unemployment levels, there are also a considerable number of people who have been furloughed from their jobs. These people are deemed ‘at risk’ employees. While HMRC provides data at local authority level on the number of people who are furloughed and supported by the Coronavirus Job Retention Scheme, there is no small area measure of rates of furloughing, meaning users are unable to explore local inequalities in the prevalence of furloughing.
In order to examine these inequalities, we modelled the Local Authority furloughing data to Output Area level based the employment sector profile of each Output Area. Figures are based on the employment sector of those resident in the Output Area (based on furloughing rates in different industry sectors). This helps to identify specific neighbourhoods with a higher proportion of employees in ‘at risk’ jobs.
Whilst this fulfils the role of providing some data against which to measure communities, it is important to consider the caveats that come with the ‘at risk’ dataset. Significantly, it is key to consider while the LA furloughing data is updated monthly, the employee sector data to apportion the data within the Local Authority, is based on Census 2011 employment sector data; therefore, areas that have had considerable change in employment profile since then will not be taken into account in our model.
New Indicators
We have also been able to draw on some new indicators developed in response to the pandemic to help identify at risk groups, including data from Ordnance Survey on quality of access to private and public open spaces – which was of special importance during the periods of lockdown – and composite indicators developed by Red Cross to capture groups who may have difficulty accessing food or may require hardship fund assistance during the pandemic.
These new indicators include
Grants Issued
As the pandemic has evolved and the impact of many of the measures to combat the virus have been felt, the response has been one of previously unseen volumes of financial support.
 We have been able to upload into Local Insight an indicator that captures the response to the pandemic by the third sector. Grants issued in response to Covid-19 takes data collected by 360 Giving on grants issued to support community groups specifically to tackle some of the challenges arising from Covid.
We have geocoded this individual level grant data to Output Area level and uploaded the results into Local Insight to produce a rate of grant issued per 100,000 population. This data can be matched against the measures of need and risk to identify areas where there are high levels of currently unmet need. We are hoping this data is especially useful for our grant foundation and community foundation clients.
Covid-19 Data Resources
We also keep a record of key statistical resources published at higher geographical levels relating to all aspects of the pandemic, with links for users to download. This table is available via our Resource and Data pages. Where resources are available at Local Authority level, we have also added them into our new interactive Local Authority indicators resource, so users can download the Local Authority Covid-19 data and upload it via the manage your data function to benchmark against the more granular data available within Local Insight.
If this all sounds like it could help you and your organisation marshal your resources better, get in touch for a demo and free trial.

The English Community Needs Index (CNI) 2023 is now published as open…
More
Social housing providers have deep, experience-based knowledge of the communities they serve….
More
Many funding programmes use the Index of Multiple Deprivation (IMD) to identify…
More


