
The unemployment claimant count data (released 19th May) provides a strong indication of the early economic impact of COVID-19. Released down to LSOA level, the data is of interest to those looking at supporting communities experiencing economic hardship as a result of the pandemic.
The figures refer to the number and proportion of working-age people receiving benefits payable to those who are unemployed (economically active but out of work) as of 9th April 2020, compared with unemployment levels on 12th March 2020 (the last reference period before the UK went into lockdown).
You can access the indicators on which the analysis is based through:
The latest unemployment data is also available in Local Insight, our mapping and reporting platform with more than 1000 local level datasets for the areas you care about (whether that is towns, wards, constituencies or parishes).
Read our guide to unemployment data for more information on understanding some of the economic impact of COVID-19.
The headline figures are striking, with the largest single monthly increase in recorded unemployment – 850,000 new claimants across the UK (an increase of 66%). This dwarfs the second largest increase in the last 25 years, which occurred during the global financial crisis of 2008/2009 – where unemployment rose by 177,000 across the UK (14%) between January and February 2009.
The increase is widespread, with every Local Authority in the UK seeing unemployment rise by more than one-third; and 76 of the 379 Local Authorities in the UK seeing their unemployment rate more than double in a single month.
Our initial analysis below focuses on the Local Authorities, towns and MSOA neighbourhoods that have experienced the largest increase in unemployment over the last month – identifying unemployment hotspots where people are more likely to be experiencing financial stress.
The data looks at the percentage point increase – calculated by subtracting the March unemployment rate from the April unemployment rate to get the change in the percentage of people receiving unemployment benefits between March and April – see here for more information about percentage point vs percentage change calculations.
The table below shows the 10 Local Authorities across the UK with the largest percentage point increases in unemployment between March and April 2020:
| Local Authority | Claimant rate March 2020 | Claimant rate April 2020 | Percentage point increase Mar-Apr 2020 |
| Isles of Scilly | 0.7 | 5.8 | 5.1 |
| Blackpool | 7.2 | 11.1 | 3.9 |
| Torbay | 3.5 | 7.1 | 3.6 |
| Thanet | 5.7 | 8.9 | 3.2 |
| Tendring | 4.6 | 7.7 | 3.1 |
| Knowsley | 4.8 | 7.9 | 3.1 |
| Scarborough | 2.9 | 6.0 | 3.1 |
| Cornwall | 2.7 | 5.8 | 3.1 |
| North Devon | 2.2 | 5.2 | 3.0 |
| Torridge | 2.3 | 5.2 | 2.9 |
Nine of these are located in Local Authorities containing seaside resorts, which indicates the economic impact of COVID-19 on hospitality and tourism industries.
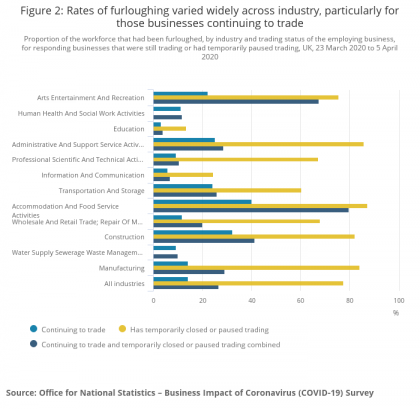
Furthermore, this corresponds with the findings of the Business Impact of Coronavirus (COVID-19) Survey (BICS) conducted by ONS which reported higher rates of furloughing and job losses in accommodation and food services and arts entertainment and recreation industries.
At the other end of the spectrum, areas with a strong knowledge economy have been less impacted, with Cambridge seeing the smallest percentage point increase in unemployment 0.9. Again, this reflects the furloughing trends identified in the BICS.
Drilling down to settlement level, we can see that smaller seaside resorts dominate the list of areas that have seen the largest percentage point increases in unemployment.
| Town | Local Authority | Claimant rate March 2020 | Claimant rate April 2020 | Percentage point increase Mar-Apr 2020 |
| St Osyth | Tendring | 4.9 | 10.9 | 6 |
| St Ives | Cornwall | 2.5 | 8.4 | 5.9 |
| Padstow | Cornwall | 2.5 | 7.8 | 5.3 |
| Flexbury | Cornwall | 4.4 | 9.6 | 5.2 |
| Perranporth | Cornwall | 1.8 | 6.9 | 5.1 |
| Newquay | Cornwall | 4.9 | 9.8 | 4.9 |
| Looe | Cornwall | 3 | 7.8 | 4.8 |
| Camelford | Cornwall | 3.9 | 8.6 | 4.7 |
| Tenby | Pembrokeshire | 2.1 | 6.8 | 4.7 |
| Fortuneswell | Dorset | 4.7 | 9 | 4.3 |
The table above shows the 10 settlements (villages, towns and cities) with the largest percentage point increases in unemployment between March and April. Seven of the 10 settlements experiencing the largest increases are found in Cornwall, and each of the 10 areas are coastal or located close to the coast – providing further evidence that coastal economies have been particularly badly affected by the pandemic.
Coastal areas now feature predominantly among the unemployment hotspots of the UK. The table below shows the 10 MSOAs/Intermediate Geographies with the highest overall unemployment rate (proportion of people receiving unemployment benefits):
| MSOA/IG | Local Authority | Unemployment claimant rate April 2020 (%) | Percentage point increase Mar-Apr 2020 |
| Central Blackpool | Blackpool | 24.4 | 4.8 |
| South Promenade & Seasiders Way | Blackpool | 23.8 | 5.6 |
| North Shore | Blackpool | 22.5 | 6.4 |
| Sparkbrook North | Birmingham | 19.3 | 3.7 |
| North East Centre | Blackpool | 18.5 | 5.2 |
| Skegness Town | East Lindsey | 17.9 | 3.5 |
| Ayr N. Harbour, Wallacetown & Newton Sth | South Ayrshire | 17.6 | 3.2 |
| Aston Park | Birmingham | 17.4 | 3.5 |
| Lozells West | Birmingham | 17.3 | 2.3 |
| Oldham Town North | Oldham | 16.1 | 4.6 |
Six of the 10 MSOAs with the highest levels of unemployment are in coastal areas. Blackpool accounts for four of the top five areas, with just under one-in four people living in Central Blackpool now in receipt of unemployment benefits. Seventeen of the 20 MSOA neighbourhoods with the largest increases in unemployment over the period were found in coastal areas.
However, the impact of unemployment is being widely felt across the country with every MSOA/Intermediate Geography neighbourhood in the UK seeing an increase in unemployment between March and April.

The English Community Needs Index (CNI) 2023 is now published as open…
More
Social housing providers have deep, experience-based knowledge of the communities they serve….
More
Many funding programmes use the Index of Multiple Deprivation (IMD) to identify…
More


